

Although its name could suggest otherwise, a weak entity can be very useful for properly modeling a database. In this article, we’ll study examples of weak entities and learn how to use them to improve your data modeling skills.
If you are about to design a data model, you probably already know what entities are and how they are represented in a diagram. If not, you can read about entities in Vertabelo’s logical model documentation.
What you may not know is that there can be different types of entities in an entity-relationship diagram (ER diagram or ERD). The type depends on the role the entity plays in the data model; different notations can be used to represent different entity types. In a data model, there can be strong entities and weak entities. In this article, we will discuss the concept of weak entity, illustrate that concept with a weak entity example, and see how weak entities are represented in an ER diagram.
To give proper context to the weak entity concept, let’s start by briefly looking at the basics of the entity-relationship diagram.
What Is an ER Diagram?
An entity-relationship diagram is a visual representation of a database. It can be an existing database or one that is being designed and has not yet been created. The ER diagram can be used for several things:
- It can be used as a conceptual view of the database that can be understood and validated by end users and project sponsors.
- It can be used as a document that allows users, developers, and stakeholders to agree on the foundation that will support a solution based on stored data.
- It can be used as a data modeling tool so that one or more database designers can work to create a blueprint of the structure of a database.
- It can be used as a validation mechanism that allows a modeler to verify that a data model meets design guidelines necessary for data integrity, such as normal forms.
There are many options when choosing an ERD tool to work on ER diagrams. These range from simple whiteboards or pen and paper to AI systems that greatly simplify the task. Check out this database design guide to better understand how database concepts translate into an ER diagram.
Basic Components of an ER Diagram
The two basic components that shape an entity-relationship diagram can be deduced from its name: entities and relationships. Since an ER diagram is a visual representation of a database, its components are representations of the elements that make up the database. The entities represent tables, and the relationships represent constraints between the attributes of different tables.
In ER diagrams, each entity is represented by a box or rectangle. The name of the entity appears as a header on the top of this box. The set of attributes that define the entity are listed inside the box. Each attribute is defined by its name, data type, length (if not implicit in the data type) and whether it is mandatory or not. If you aren’t clear about the concepts of entity and attribute, I advise you to read about the difference between attributes and entities in a data model.
Relationships in an ER diagram are represented as lines linking entities. The cardinality of the relationship is expressed by the terminations of the lines. A line that ends with a short, perpendicular dash indicates unary cardinality, while a line that opens into three lines (a symbol commonly called a “crow’s foot”) indicates a multiple cardinality. A one-to-many relationship, for example, is represented by a perpendicular dashed unary termination on the “one” side and a crow’s foot on the “many” side.
The mandatory or optional status of entities in a relationship is also represented visually: If an entity is mandatory, it is indicated by a perpendicular dash; otherwise, it is represented by an empty circle. Follow this link to learn more about commonly-used symbols in an ERD diagram. The notation described so far is implemented in almost any ERD tool.
What Are Weak Entities in an ERD?
In a data model, weak entities are those that need an attribute from another entity (i.e. a foreign key) to constitute a unique identifier. In other words, the primary key of a weak entity needs to contain a foreign key that relates it to a strong entity. On the other hand, a strong entity is one that has a unique identifier among its own attributes; it does not depend on foreign keys. The foreign key of the weak entity is normally the primary key of the related strong entity.
Conceptually, we could say that the very existence of the weak entity depends on the strong entity. Without the strong entity, the weak entity would have no reason to exist. Consider a weak entity example of two entities, Course and Registration:
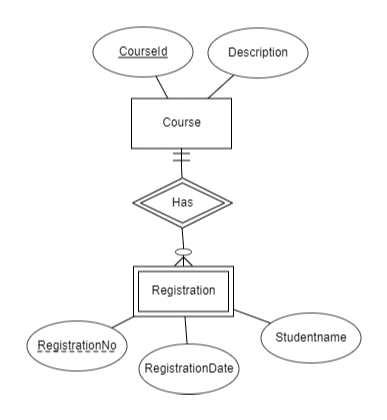
A Chen ER diagram depicting a weak and a strong entity.
Course is a strong entity; CourseId and Description are candidate attributes to become unique identifiers, so Course does not need foreign attributes to have a unique key. Registration, on the other hand, needs the identifier attribute of the strong entity to form a unique identifier.
Notating Weak Entities in an ER Diagram
As we saw in the previous example, Chen’s notation represents weak entities as a double-lined rectangle, to differentiate them from the strong entity, which is drawn as a single-lined rectangle. In turn, the relationship between the weak entity and its corresponding strong entity is symbolized as a double-lined rhombus. This type of relationship (between a strong entity and a weak entity) is called an identifying relationship.
The following example shows the data model of an ordering system that contains the following entities:
CustomerOrderOrderItemProduct
It is clear that OrderItem cannot exist if Order does not exist. That is why OrderItem is a weak entity.
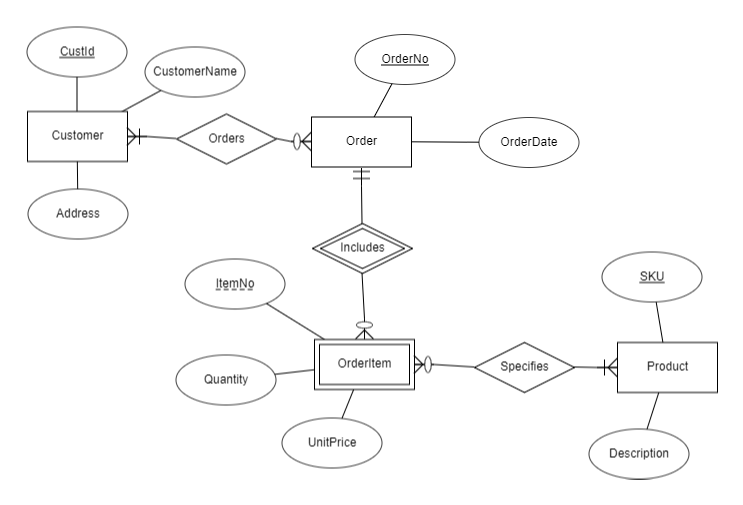
Chen diagram showing the data model for an ordering system.
Implementing a Weak Entity
Let's see how to transform the above diagram into a logical data model using the Vertabelo data modeling tool. Check out the first steps using online data modeling if you need a kickstart.
First, we will convert the previous Chen diagram into a logical model. Then we can automatically generate a physical diagram and finally transform that into an operational database.
When converting the Chen ERD diagram into a not-obsolete-at-all logical model in Vertabelo, weak entity notation will show some changes. These changes leave out superfluous aspects of the Chen notation, simplifying the diagram and making it more familiar to those of us who work with database tools. Here are some of the differences:
- Attributes do not appear as bubbles surrounding an entity; they are now shown as a list inside the entity box. This gives us a visualization more similar to the structure of a table in a database.
- Relationships move away from the diamond format and become simple lines that connect entities. The names of the relationships are not shown in the diagram, since these names have no relevance for the usual use of the database.
- No visual differentiation is made between strong and weak entities, although a difference is made in the notation of the relationship between them. This difference is explained below.
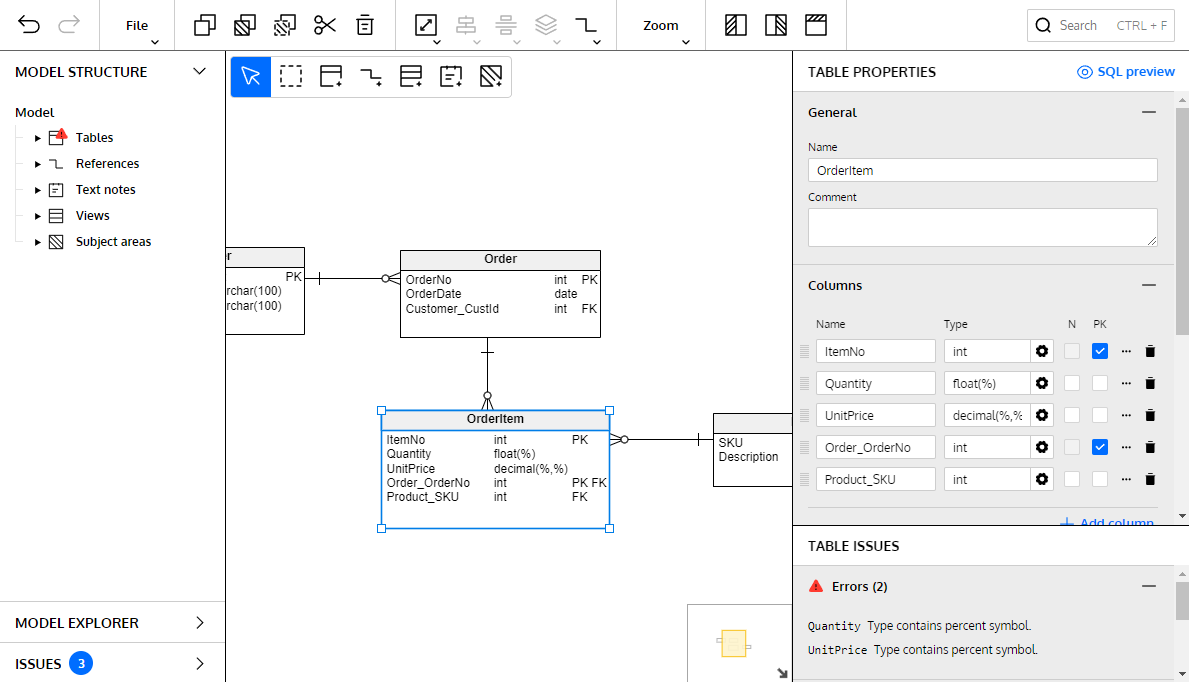
This is how the model created as a logical diagram in Vertabelo looks like:
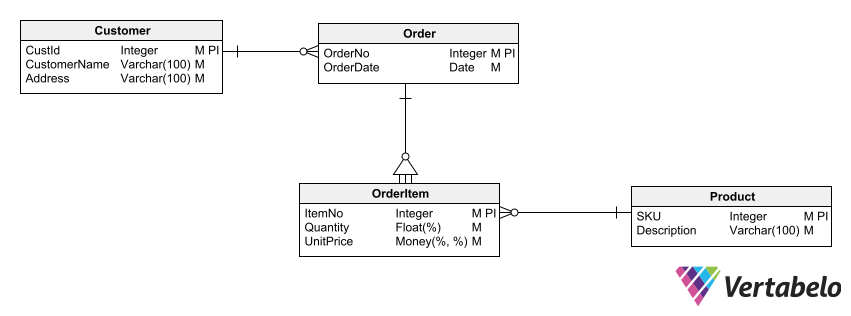
When you transform a data model into a logical diagram in Vertabelo, some superfluous aspects of the Chen notation are left out.
Strong and Weak Entities in a Logical Diagram
When drawing entities in a logical diagram in Vertabelo there is no way to explicitly indicate whether an entity is strong or weak. However, you can make a differentiation in the relationship between a strong and a weak entity. This is done by selecting the Dependant property at the end of the relationship that connects to the weak entity.
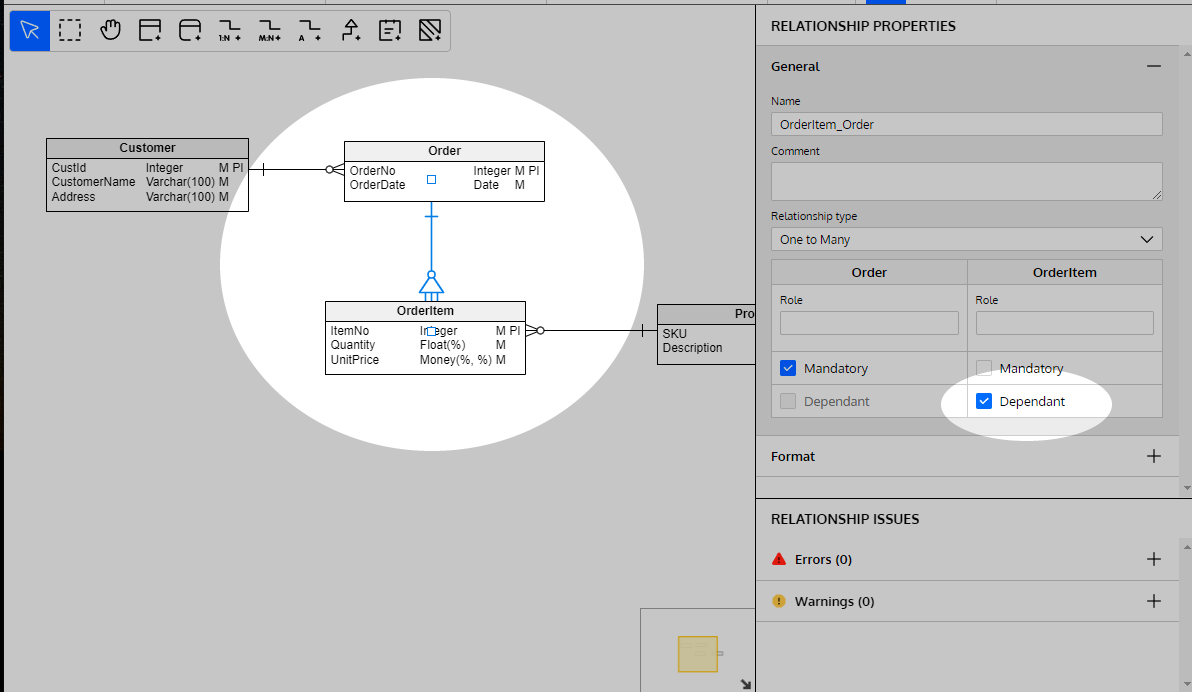
The Dependant property turns the relationship into an identifying one.
When the Dependant property is assigned to the end of a relationship, the connector of that end is no longer a crow’s foot but a triangle with three lines that connect it to the entity.
This property makes the relationship identifying, which means that the entity is weak because it needs the foreign key generated by the relationship in order to have a primary key. This will become clearer when we convert this logical diagram into a physical one, which we will see next.
Weak Entities in a Physical Diagram
With a simple click on a contextual menu, Vertabelo allows us to generate a physical diagram from a logical one:
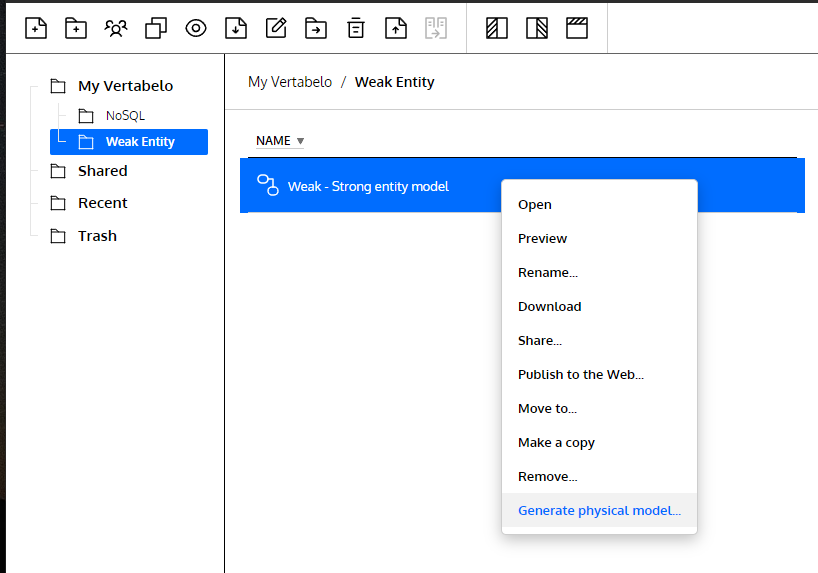
Generating a physical model from a logical model.
By doing so with the logical diagram of the previous example, we should obtain the following physical diagram:
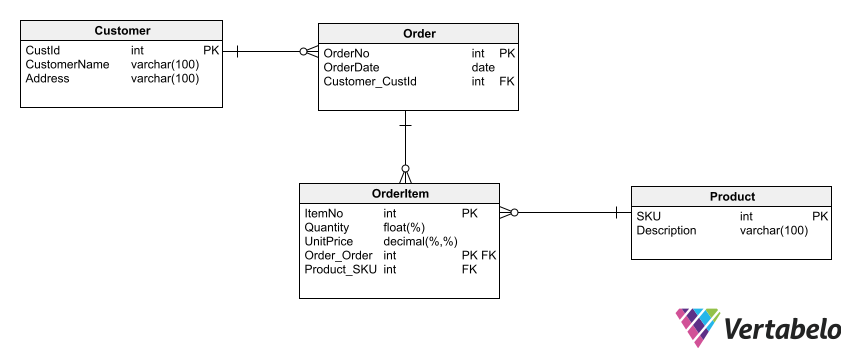
The resulting physical diagram shows how a weak entity could be implemented on a database.
By doing this, several things happened to our weak OrderItem entity:
- The end of the relationship between
OrderandOrderItembecame a conventional crow’s foot (the relationship became simply one-to-many). This happened because relationships in a physical diagram have no Dependant - A new attribute appeared on the
OrderItementity calledOrder_OrderNo, which is a foreign key relatingOrderItemtoOrder. - The
Order_OrderNoattribute became part of the primary key ofOrderItem. The fact that this attribute is both foreign key and primary key makesOrderItema weak entity – even if this condition is not explicitly shown in the diagram.
One of the PK attributes in OrderItem is a FK to Order, which converts OrderItem into a weak entity.
When and How to Use a Weak Entity
In your day-to-day work as a data modeler, you will commonly find yourself creating an entity with numerous attributes of the same class. It is at those times when you should take a step back and look at your ERD from a little further away. Consider if adding a weak entity will improve your design, making it more flexible and efficient.
Let’s examine an example that illustrates a fairly common situation: creating a database that stores the contents of a spreadsheet that someone else designed.
The big drawback of spreadsheets is that they can be used by anyone. Thus, those who design them do not usually apply sound data modeling criteria. For example, you could come across a spreadsheet like the one below, which contains data on household composition:
|
Family Name |
Parent |
Parent |
Child |
Child |
||||
|
Name |
Age |
Name |
Age |
Name |
Age |
Name |
Age |
|
|
Foster |
Charles |
55 |
Darlene |
49 |
Timothy |
19 |
Stephanie |
15 |
|
Plunkett |
Bonnie |
47 |
|
|
Martin |
14 |
|
|
|
Barlow |
Samantha |
35 |
Michael |
37 |
Matthew |
12 |
Madison |
7 |
|
Hamill |
George |
41 |
Mary |
42 |
Megan |
17 |
|
|
When faced with a task like this, your first impulse will probably be to create a single table with 9 columns, which almost exactly mirrors the structure of the spreadsheet and allows you to insert the data as it appears in it.
However, a closer look reveals that the spreadsheet hides a somewhat more complex structure than meets the eye. There is an obvious main entity, which is Family. That is easy to understand, since each row of the spreadsheet contains the data of a family.
But hidden in the rows of this spreadsheet is another entity, which is perhaps not so obvious - unless you have a lot of experience creating data models from spreadsheets. We can see that each family (in each row of the spreadsheet) includes data for:
- Two or only one parent, and
- Up to two children.
For each person, the name and age are included. We can deduce that in each family there is a certain number of family members, which reveals before our eyes the second entity hidden in the rows of the spreadsheet.
If we keep the idea of representing this data model with a single Family entity, we will have (at least) two problems:
- Waste of storage space when a family has a single parent or has less than two children.
- The impossibility of storing complete data for families with more than two children (unless we keep adding columns to the table, which will lead to even more wasted storage space).
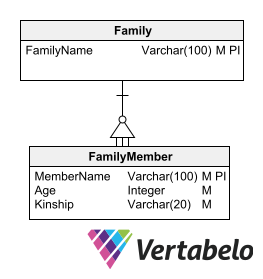
In this case, a weak entity will come to the rescue. We see that the members of the family group are all of the same class (family members) and that each of them is identified by two pieces of information: name and age. So, instead of extending the Family entity by adding attributes to it, we will leave it with a single attribute - FamilyName - and the rest of the information will be taken to a weak entity called FamilyMember. This weak entity will have the two attributes that the parents and children share in the original template: Name and Age. And we will also have to add one more attribute that indicates the kinship of each member of the family (parent or child).
You may wonder why FamilyMember has to be a weak entity. The reason is that the names of the members of a family can be repeated between different families. So, in order to have a unique identifier, FamilyMember needs the FamilyName attribute; this is a foreign key that relates it to the strong entity Family.
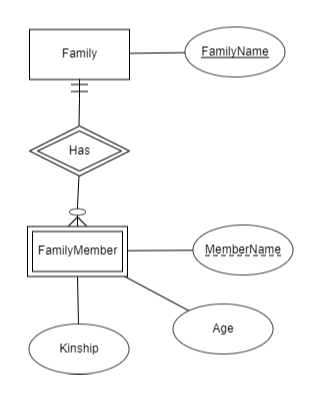
The weak entity FamilyMember and its corresponding strong entity Family.
When we implement this model as a Vertabelo logical diagram, we are left with something like this:
I leave it to you as a homework assignment to convert this design into a physical diagram.
Weak Entities In Your ER Diagram
Throughout this article, we have taken a quick look at the characteristics of ER diagrams and their basic components. We discovered what a weak entity is and how to represent it in an ER diagram. Next, we discovered how to implement a model that includes weak and strong entities using a Vertabelo logical diagram. Finally, we saw how the use of weak entities gives flexibility and efficiency to a data model. Using all of this knowledge, you will be able to create databases that last over time and provide accurate and efficient information.
