

In this article, you will learn some practical tips for organizing data models, creating readable layouts, and efficiently working with ERDs (entity-relationship diagrams).
Database diagrams are to applications what blueprints are to buildings. The more components a building has, the more complicated it is to design. Unlike buildings, though, databases undergo persistent changes, which is why ER diagrams are used to understand the structure of the database and ensure that the most current models are deployed.
Any realistic application usually contains hundreds of entities and even more relations between those entities. Creating and maintaining such ER diagrams is difficult if you don’t have the right set of rules and tools to work with the diagrams. Having a good ER diagram layout ensures that it’s easy to add new entities, relationships, subject areas, etc.
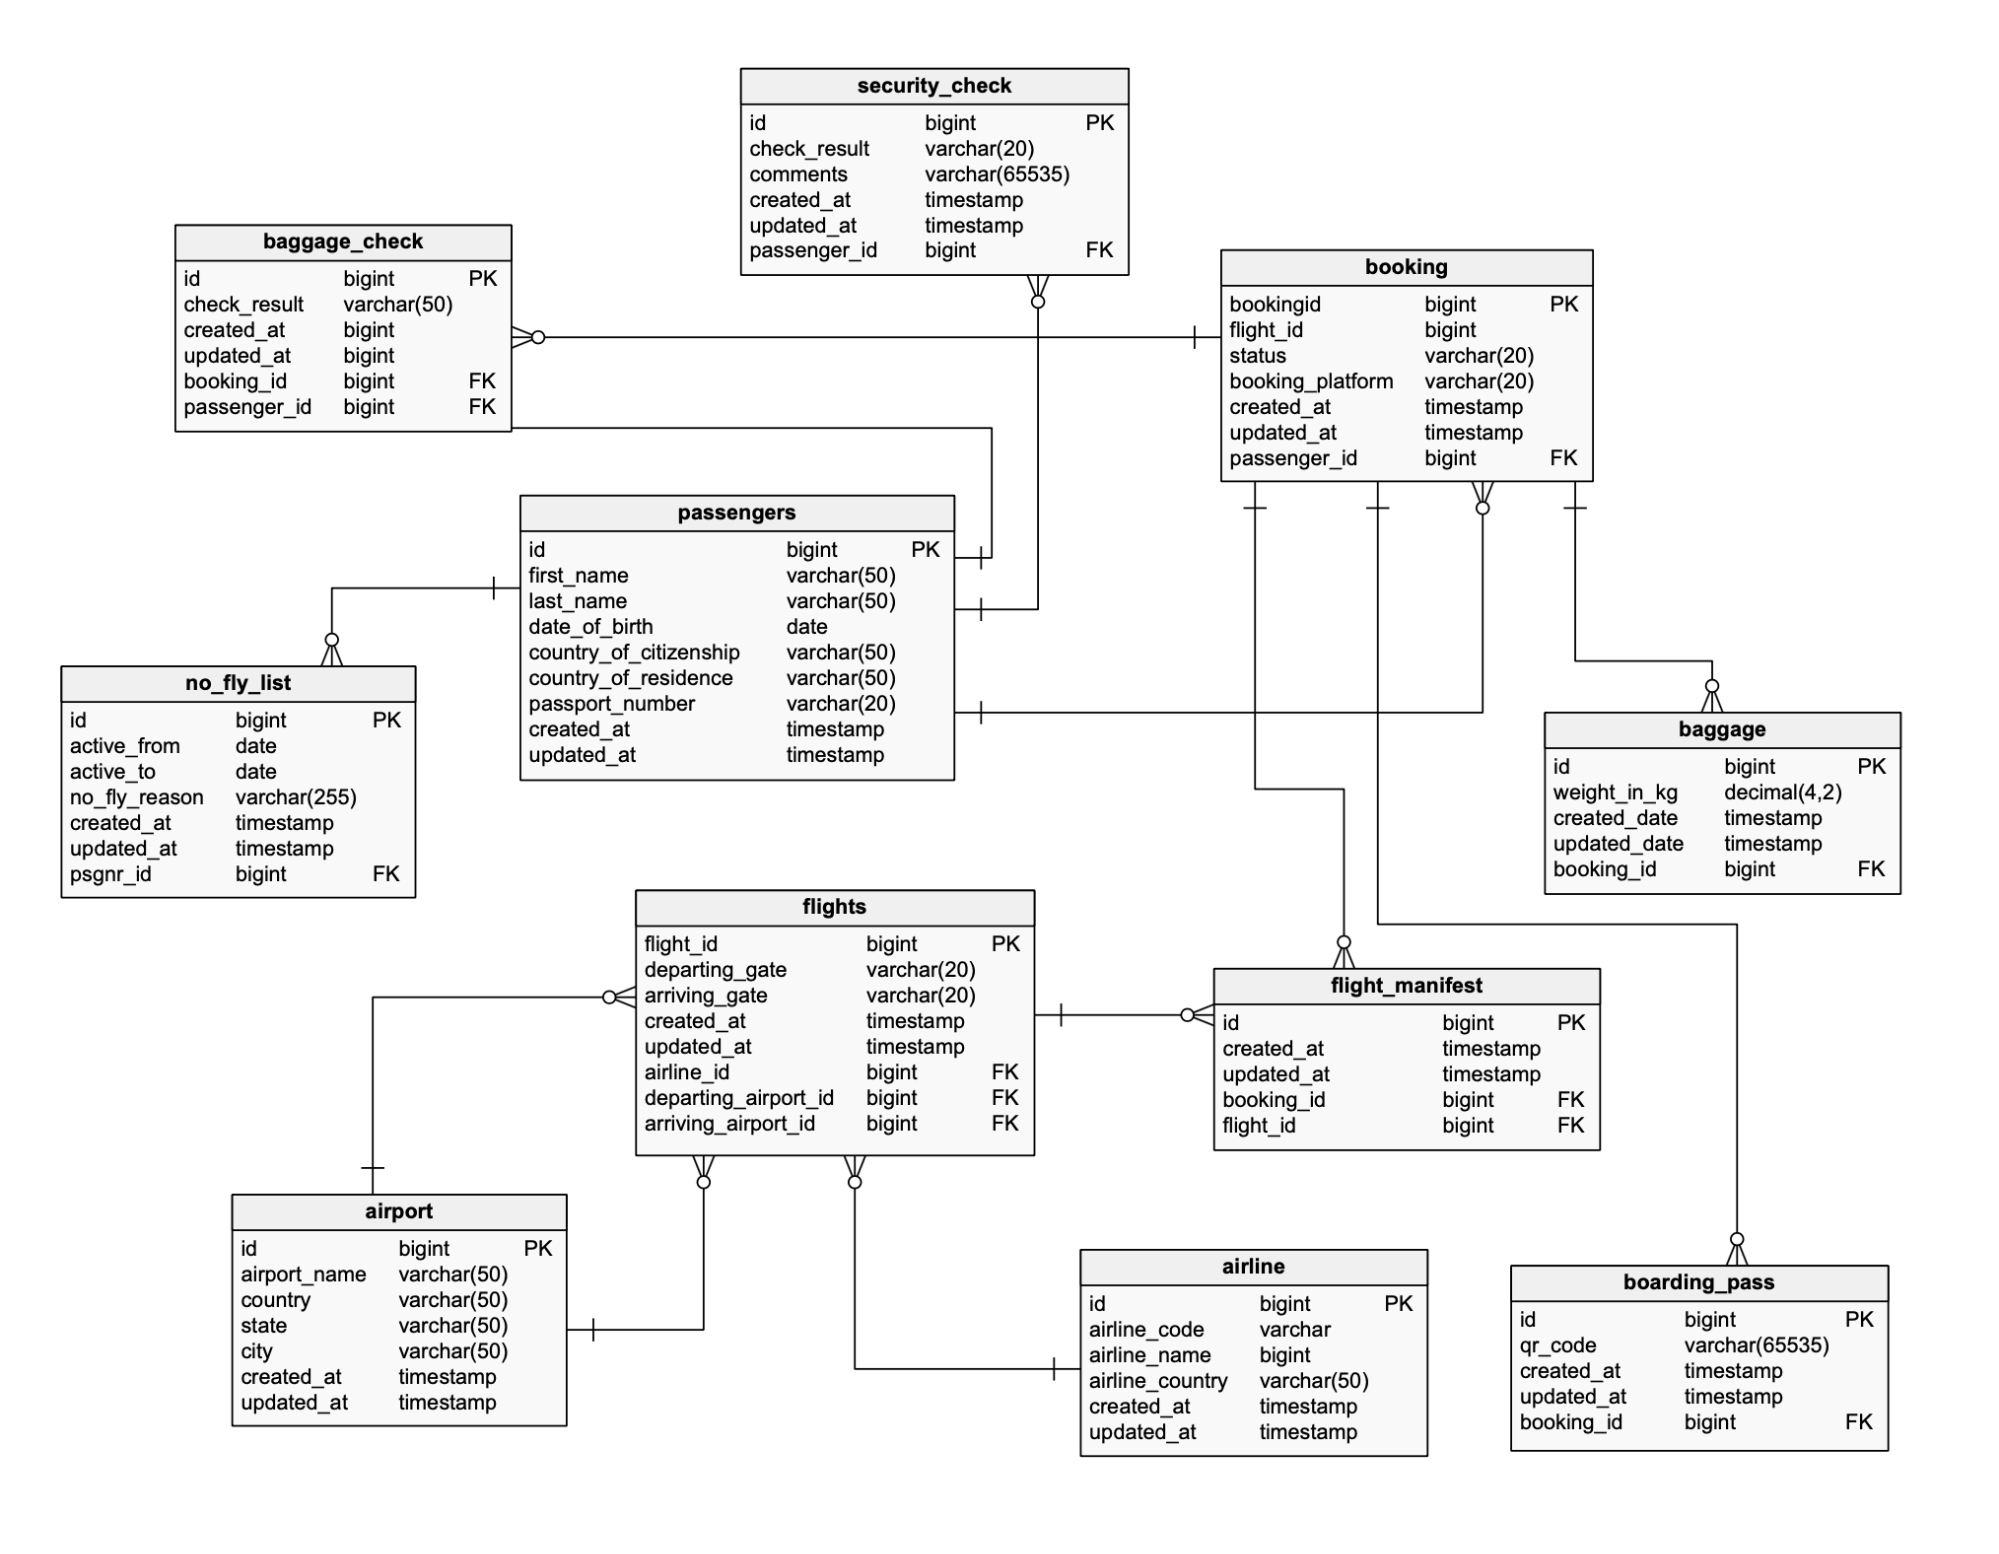
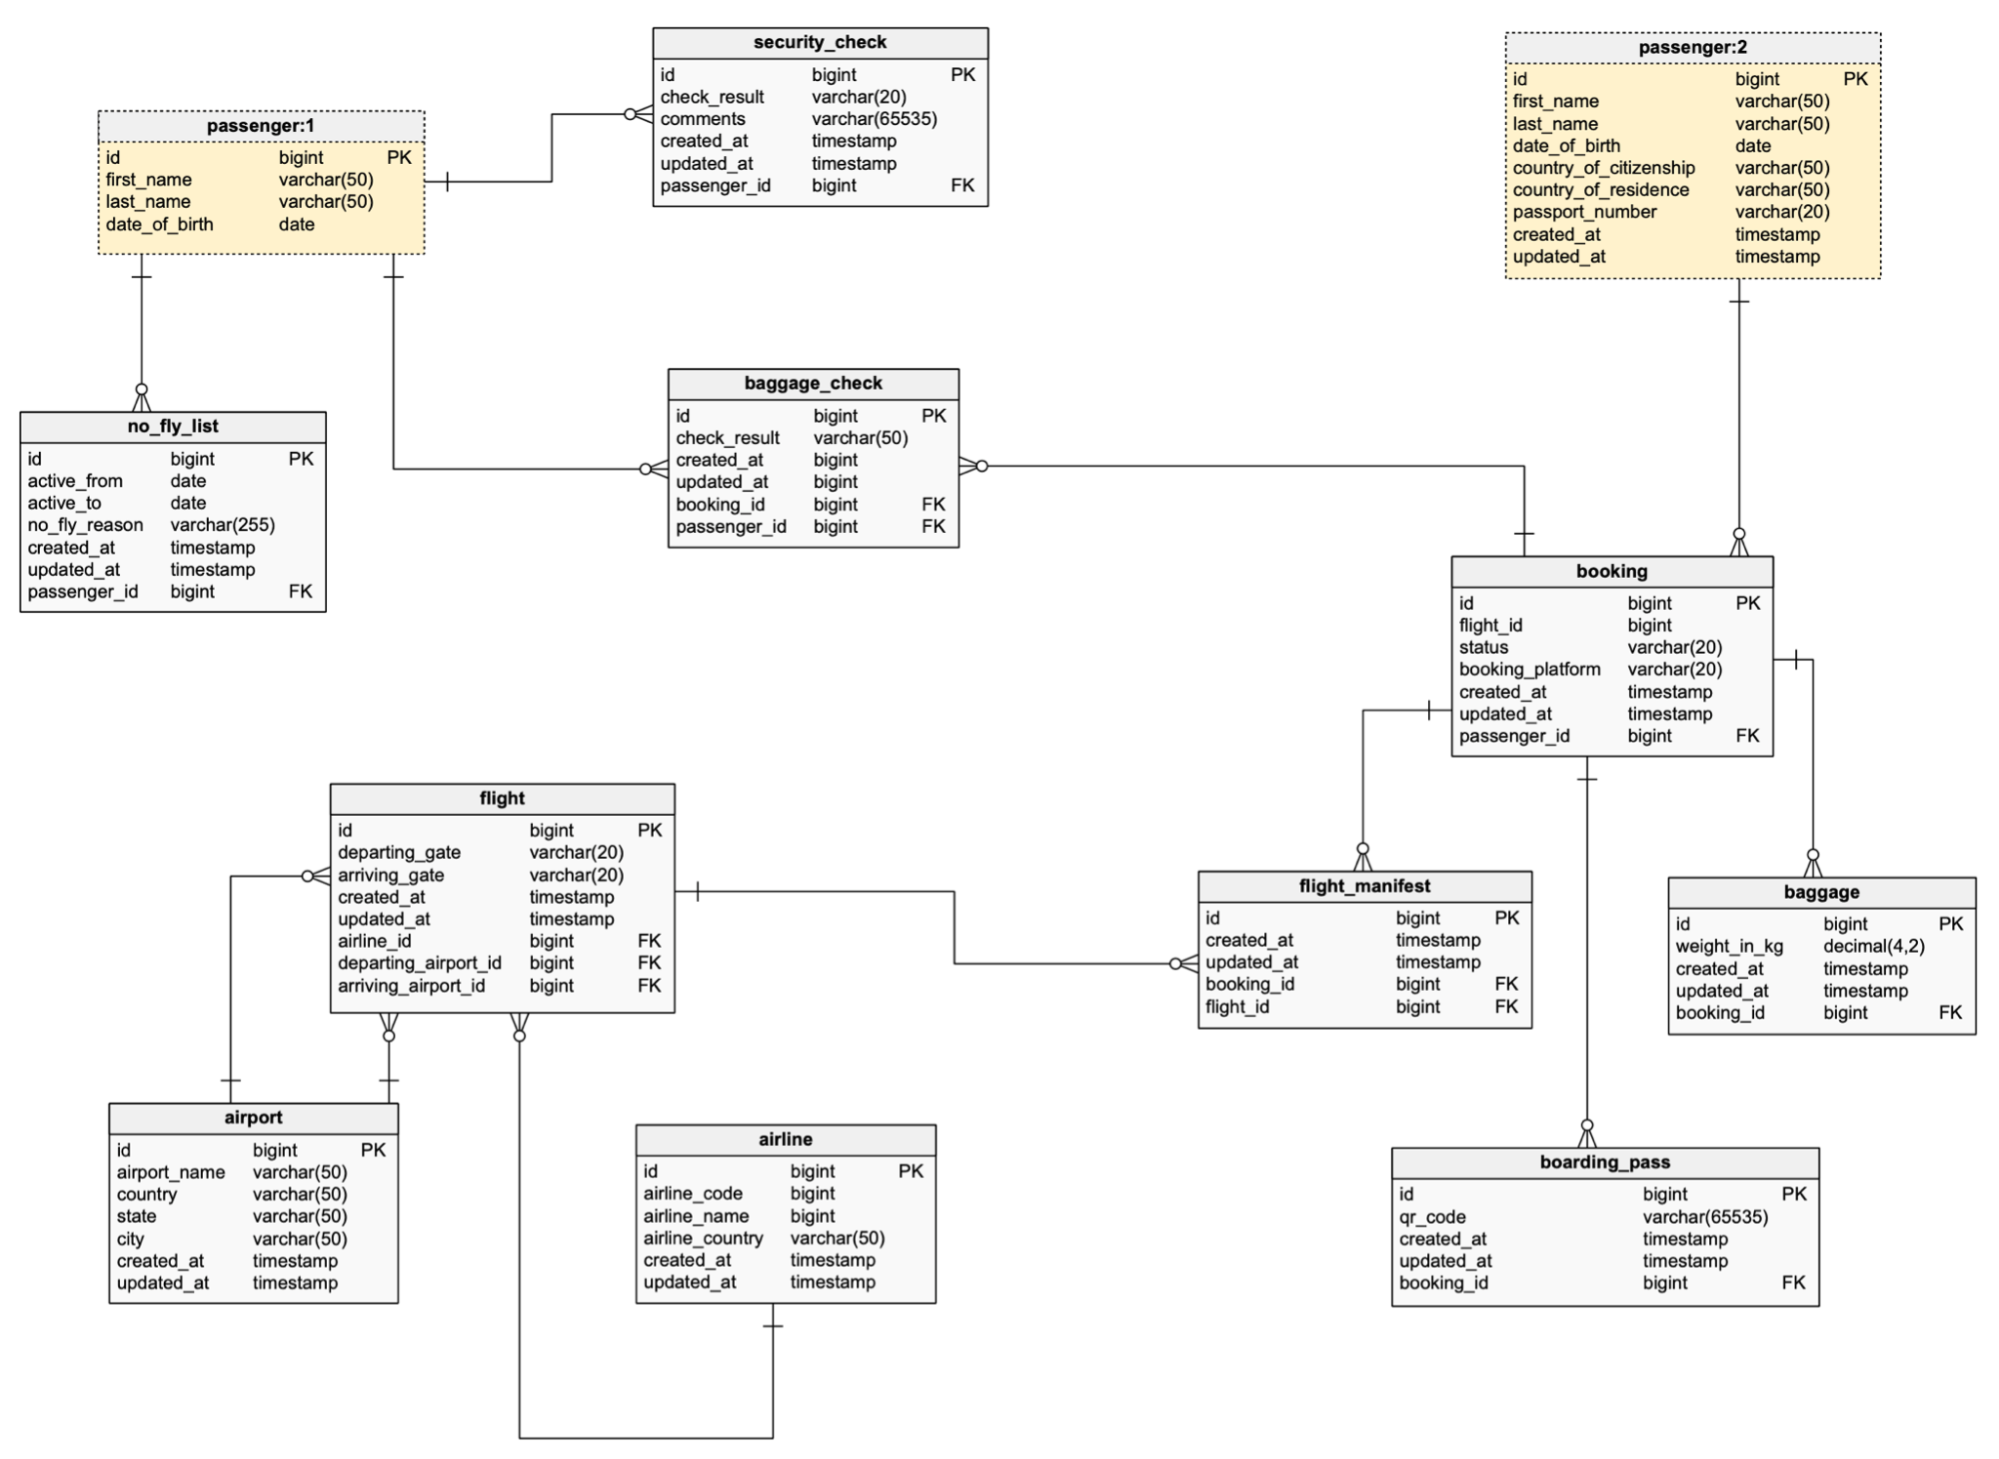
In this article, we’ll explain some best practices for organizing your ERD. To demonstrate concepts, we’ll work with a sample of a basic flight booking system. I’ll point out some of its problems, and we’ll work to correct them and build a reasonably well-designed ER diagram. While fixing the problems, I’ll introduce the seven tips, one by one. To get started, here’s the first draft of the flight booking model:
7 Things That Ensure a Good ER Diagram Layout
1. Follow a Naming Convention
Using consistent naming conventions in your data model makes life easier for anyone reading or modifying the model. Naming conventions are not only good to have for all the database objects (tables, references, etc.), they’re also good to have for Vertabelo-specific features like model names, tags, subject areas, and shortcut tables. We’ll talk about some of these features later.
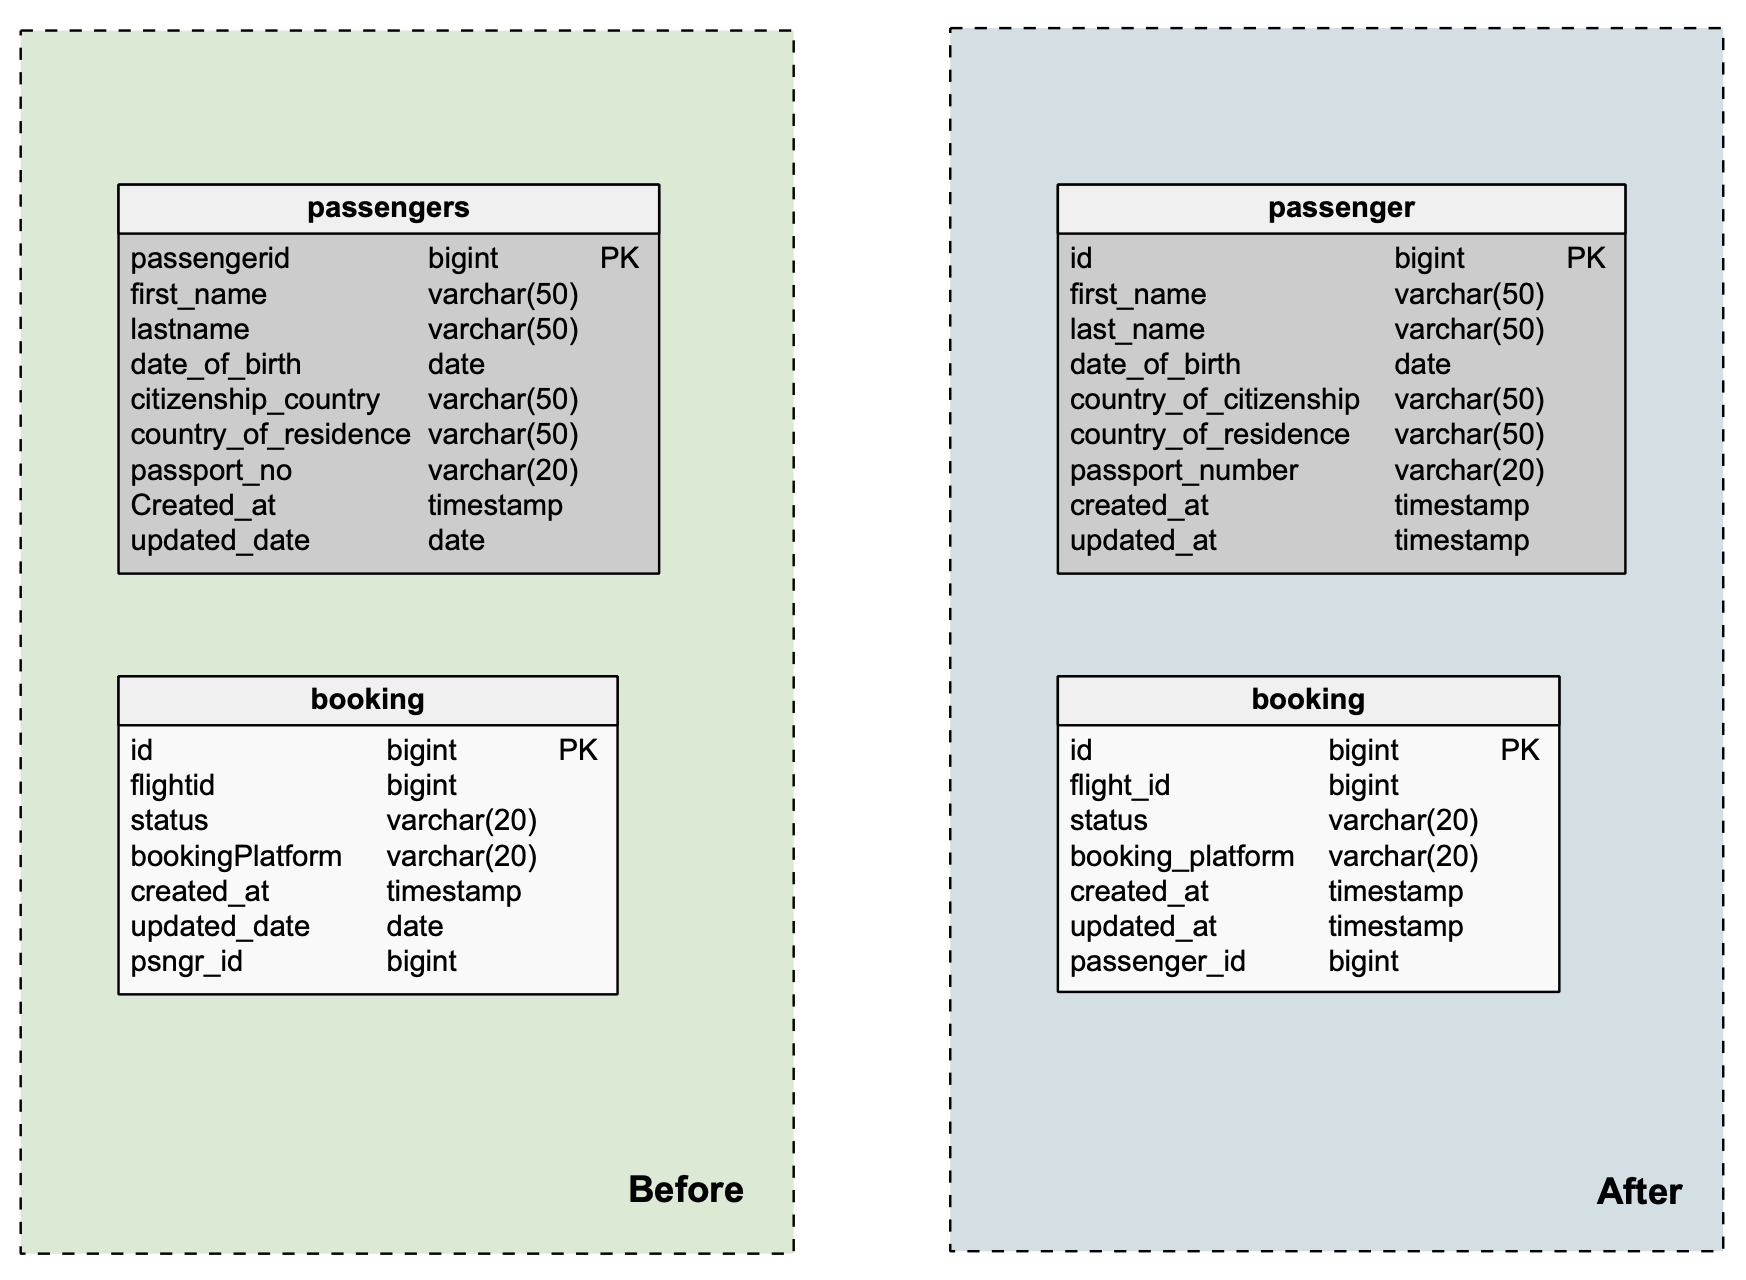
In the image above, there are several naming issues in the two tables on the left. On the right, you can see the corrected tables. In the list below, I’ve identified some of the best practices we applied to these tables:
- Use either singular or plural table names. In this case,
passengersis renamedpassenger. - Use consistent column names. We changed
flightidtoflight_idandpsngr_idtopassenger_id. All other column names should follow the same standard, e.g.citizenship_countryis nowcountry_of_citizenshipto match the columncountry_of_residence. - Timestamp columns should have consistent names and data types. The
updated_date(DATE type) columns in both tables are nowupdated_at(TIMESTAMP type).
Naming convention documents aren’t always available when you’re working with database models. If that’s the case, follow the naming pattern used in the model for consistency’s sake.
2. Avoid Overlapping References
In an ER diagram, relationships between entities are denoted by reference lines. When there are tens or hundreds of tables, it’s easy to get confused by reference lines overlapping each other or hiding behind entities. In some complex data models, you may not be able to remove all overlaps. However, minimizing overlaps increases the readability and navigability of your ER diagram.
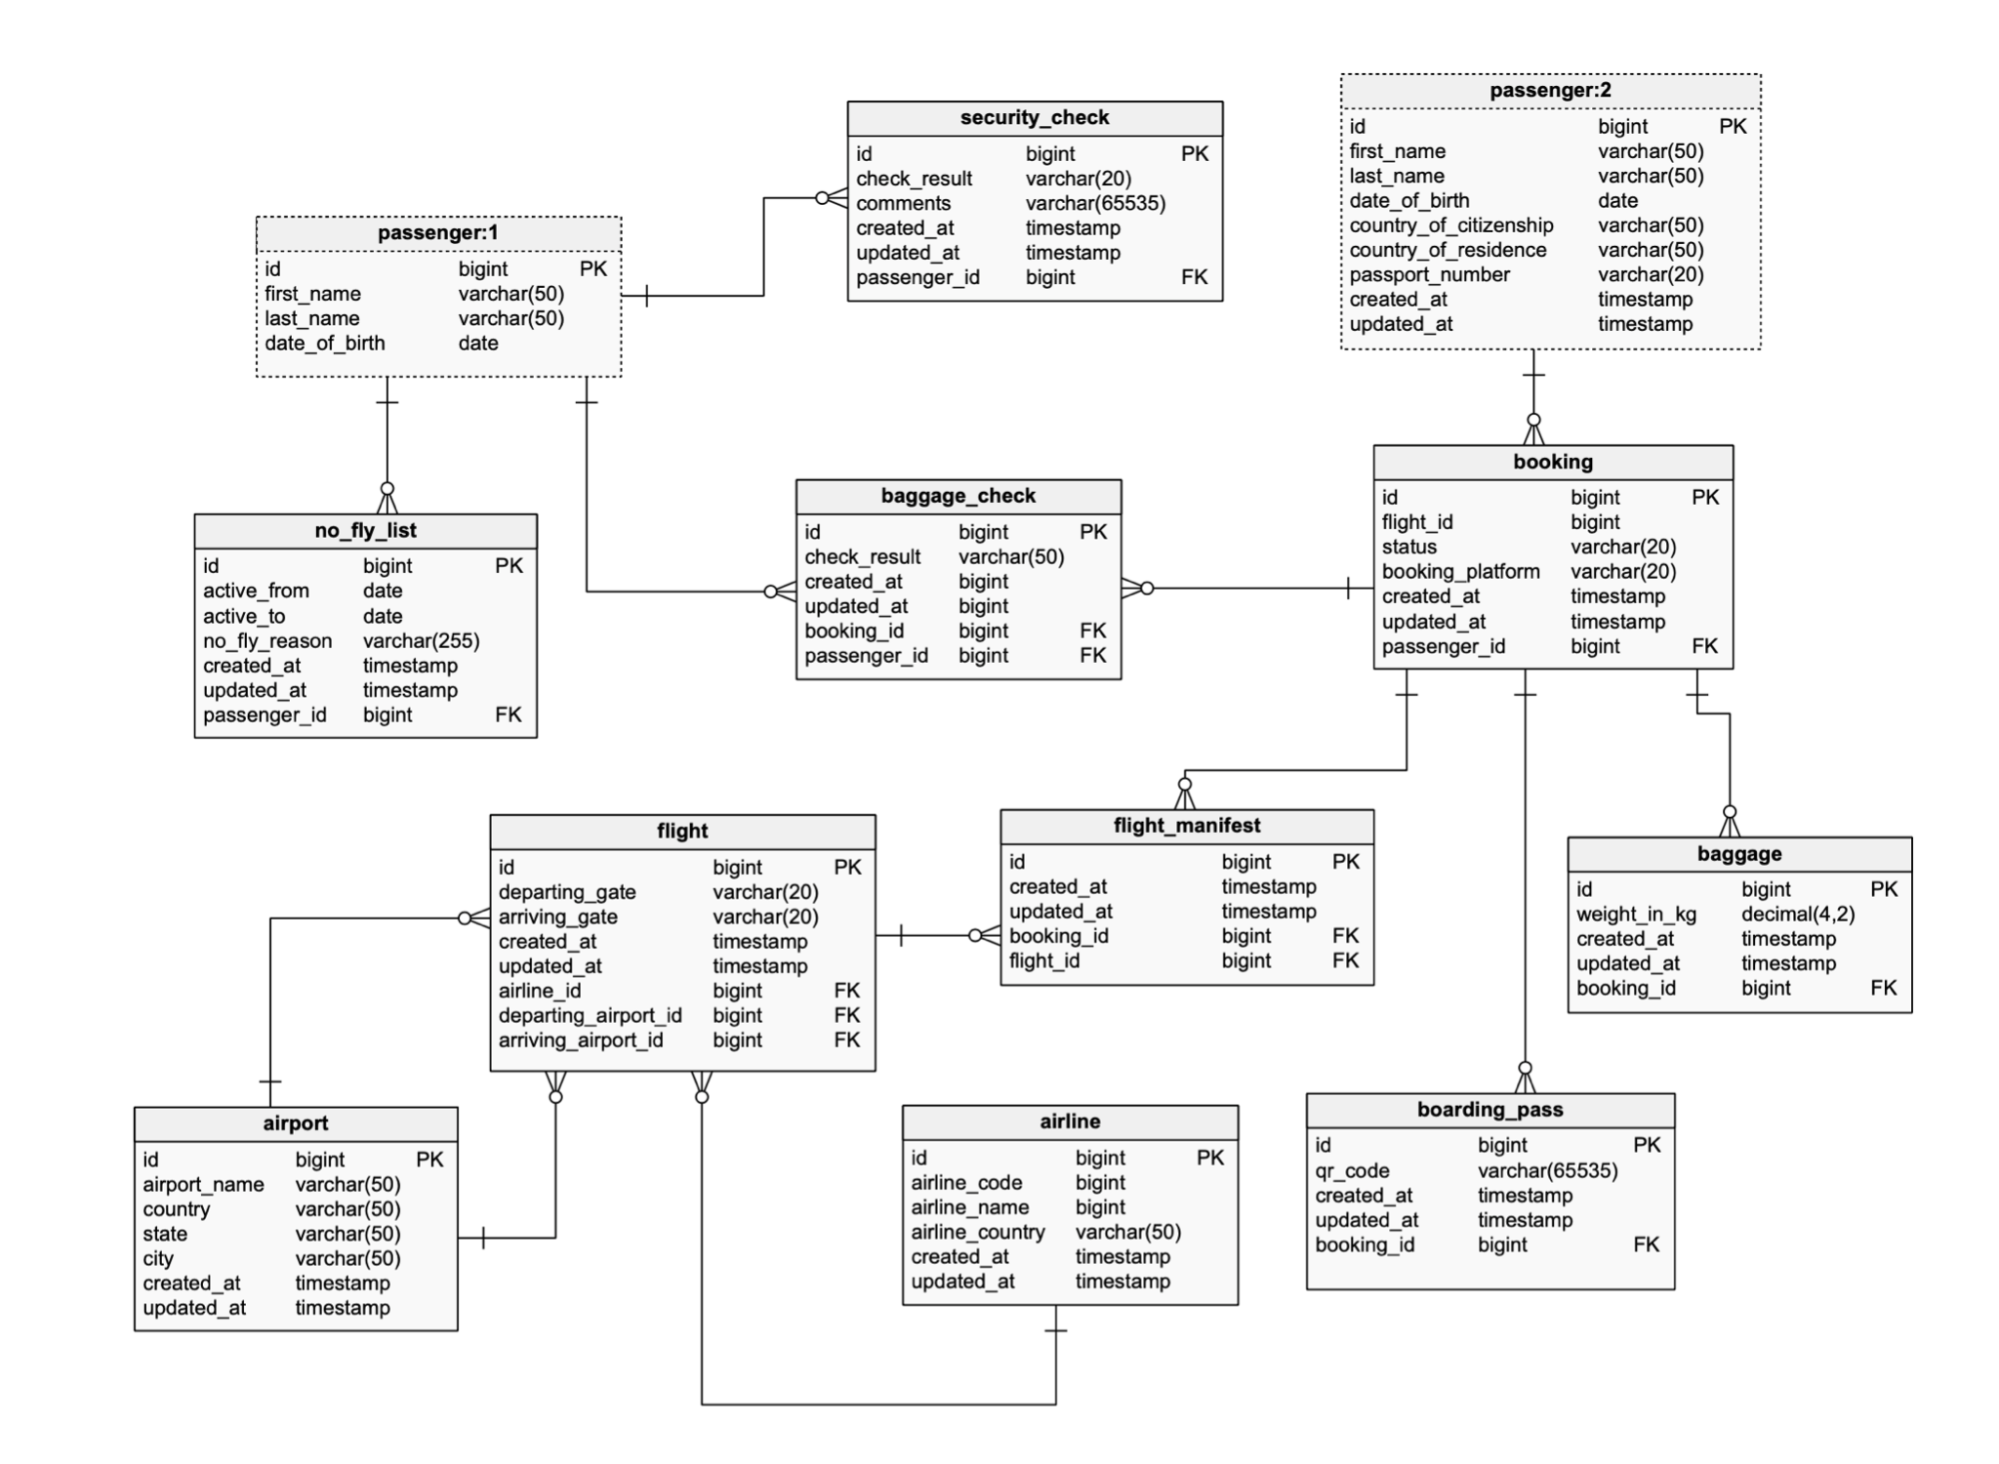
In the following ERD, we’ve tried to untangle the references shown in the previous version by removing any overlaps. You can achieve this by identifying points of contention, i.e. the tables that are being referenced the most. In our case, creating a shortcut table for the passenger table helped a lot. After that, you can untangle every reference, one at a time.
3. Use Color Coding
Color coding database objects and elements of the ER diagram is highly underrated. In a star schema, you can use color coding to denote the types of fact, dimension, and history tables. You can also use different colors for tables that are present in the ER model but aren’t used anymore.
Color coding is granular. Vertabelo enables you to color code the largest of elements in an ER diagram (i.e. subject areas), while also allowing you to color code at the table and even column level – you can use different colors for primary keys and NOT NULL columns, for instance. You can use color coding to distinguish between different subject areas, and different types of tables, namely, regular and shortcut tables. Feel free to extend the usage of color to whatever makes sense for your ER model.
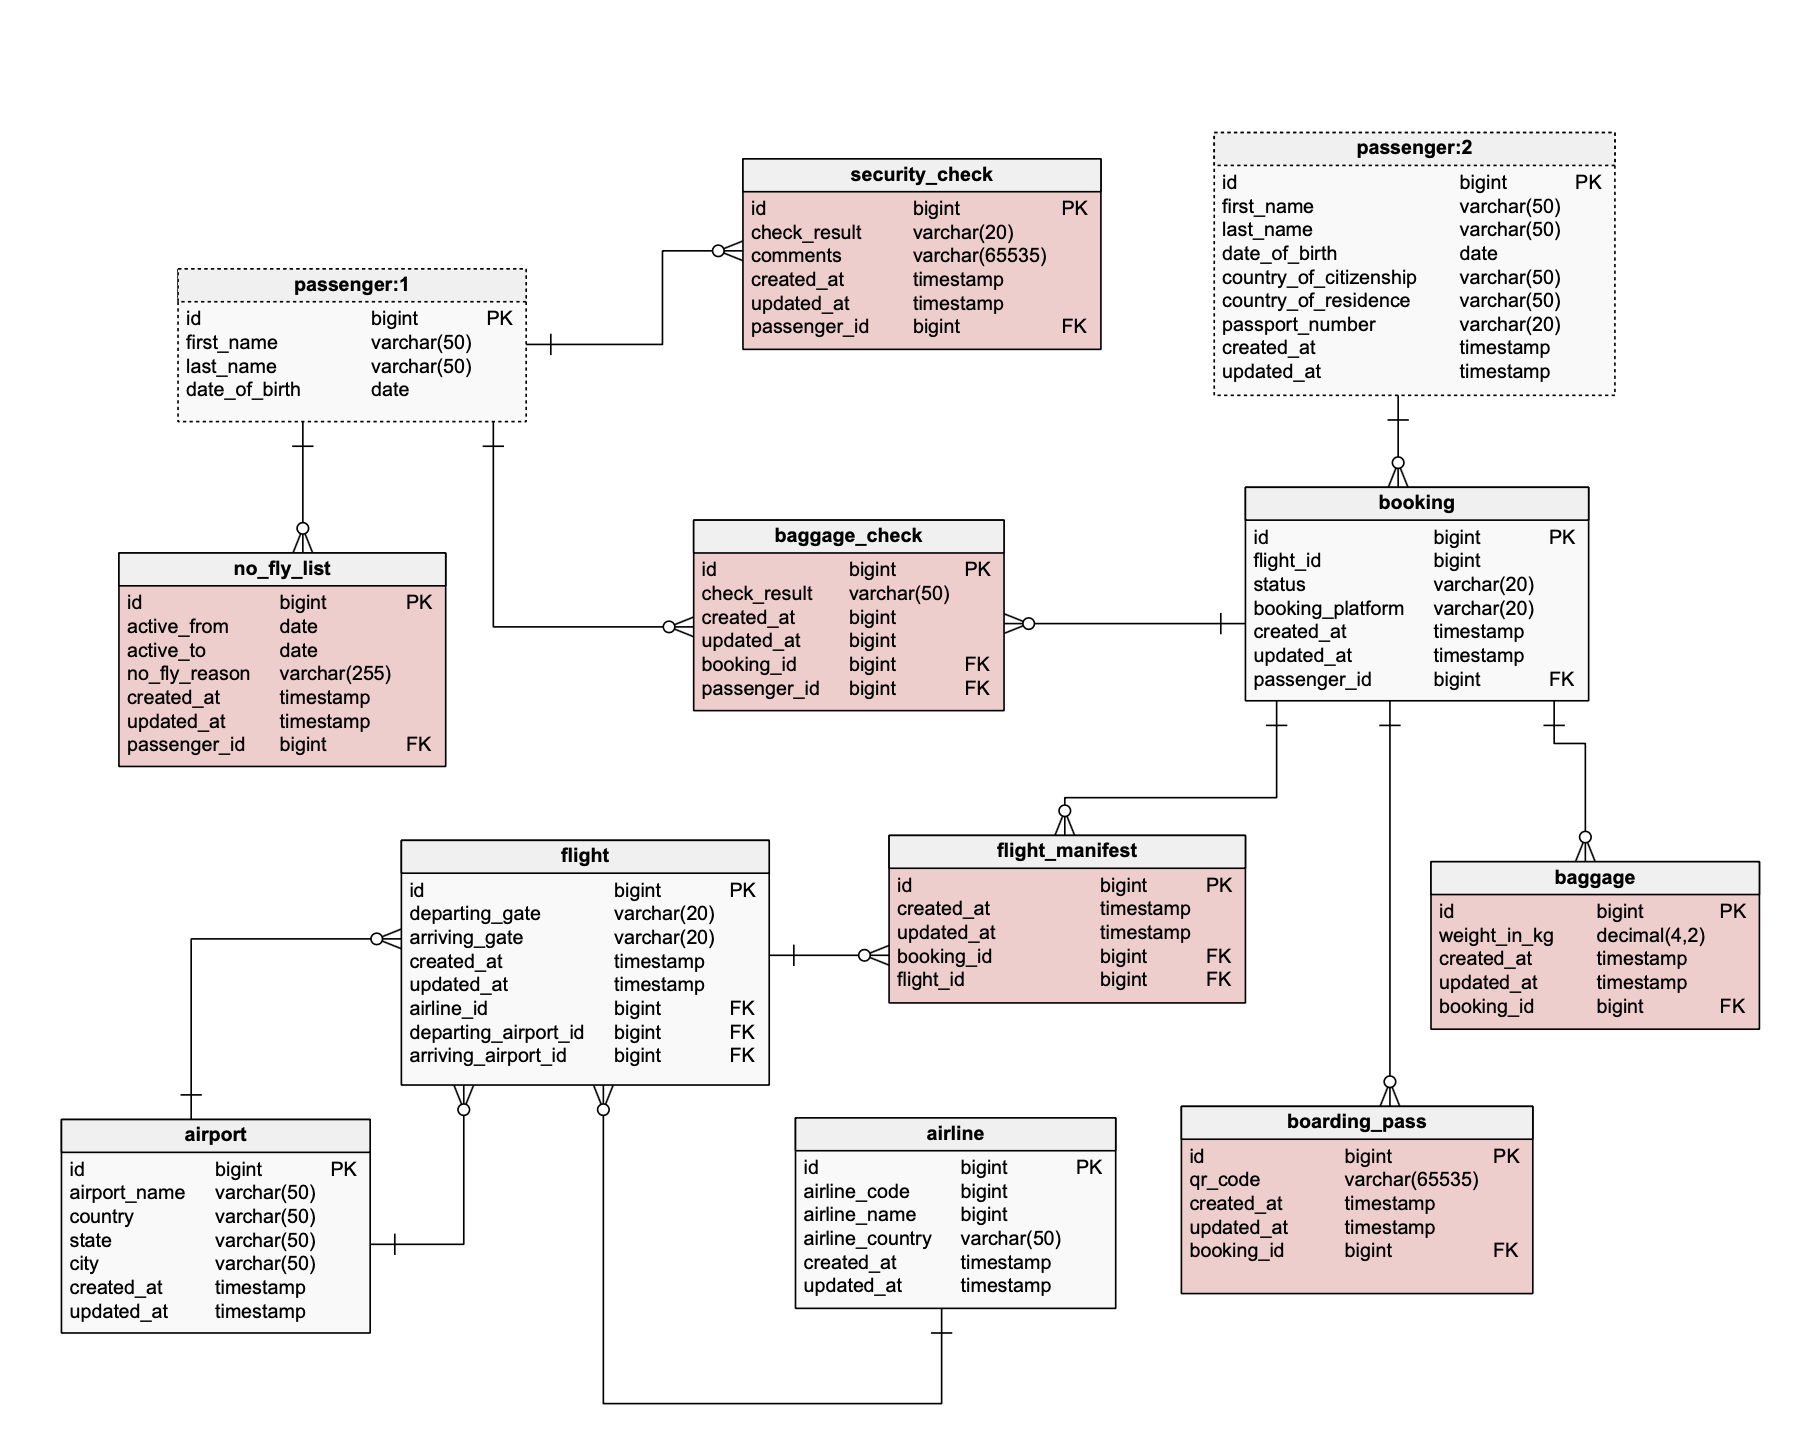
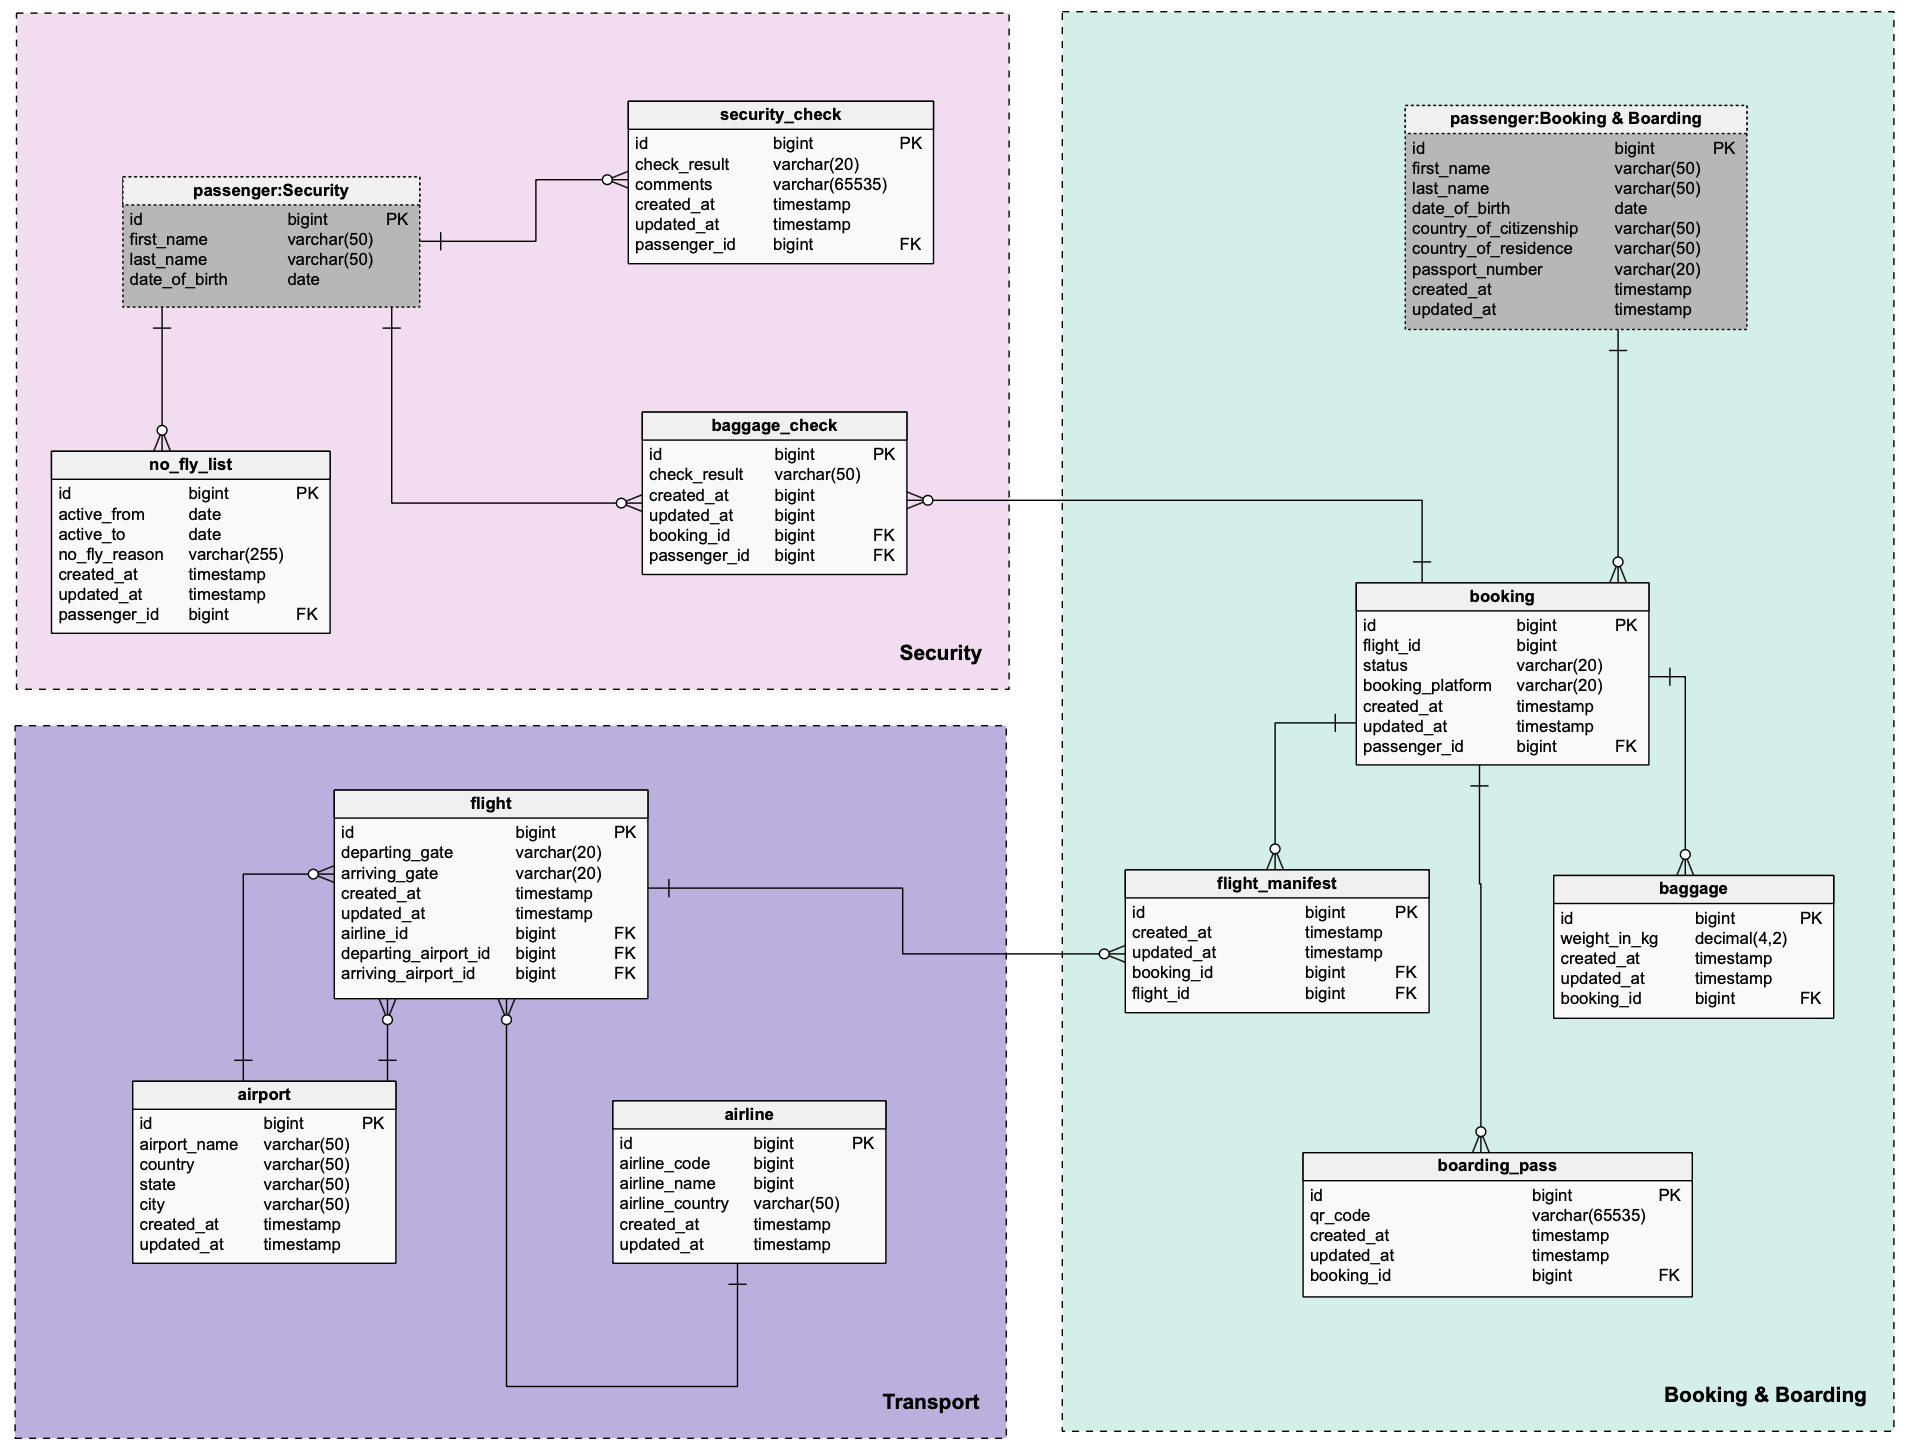
The ER diagram above uses colors to identify tables related to airport, flight, and passenger security.
4. Simplify with Shortcut Tables
When ER diagrams get very large and complex, there are usually some tables that are more frequently referenced than others. In such cases, it gets pretty challenging to prevent reference overlaps.
Vertabelo has devised a way to cope with this problem by creating shortcut tables. These tables are references (or aliases) to the original table, but they can be placed anywhere. This enables easy referencing without compromising the diagram’s readability and navigability.
In the following diagram, you can see that a shortcut table has been created for the passenger table, which has a relationship with four different tables in the model.
Shortcut tables are commonly used within subject areas, but you can use them outside of subject areas as well. When you create a shortcut table outside a subject area, its name will take the form of table_name:number. On the other hand, when you use shortcut tables inside subject areas, the shortcut table’s name will take the form table_name:subject_area_name. To derive the most value out of this feature, use it within subject areas.
5. Create Subject Areas
Just like an application can usually be divided into several services based on the domain, ERD entities can be split into different domains called subject areas. Vertabelo enables you to create subject areas, name them, and color code them for better readability. Subject areas help with the readability and navigation of the ER model; they also cater to the aesthetic sensibility of ERD viewers and creators.
In our flight booking data model, we’ve segregated our entities into three different subject areas:
Security(colored pink).Transport(colored purple).Booking & Boarding(colored green).
6. Use Vertabelo’s Alignment Feature
Vertabelo has another handy design feature: subject area and table alignment. This feature is more advantageous from an aesthetic/design point of view. If you’re presenting the model in a meeting, you don’t want it to look chaotic – no matter how well you’ve actually designed it. In fact, Vertabelo offers many model formatting tools and utilities you can use to polish your model.
In the ER diagram below, we’ve applied the following alignment rules:
- The width of all the tables is set to fit the text and column definitions.
- The tables
passenger:Security, no_fly_list, andairportare left-aligned. - The tables
passenger:Security, security_check, andpassenger:Booking & Boardingare top-aligned. - The tables
passenger:Booking & Boarding, bookingandboarding_passare left-aligned. - The tables
airport,airline, andboarding_passare bottom-aligned. - The tables
flightflight_manifest, andbaggageare also bottom-aligned.
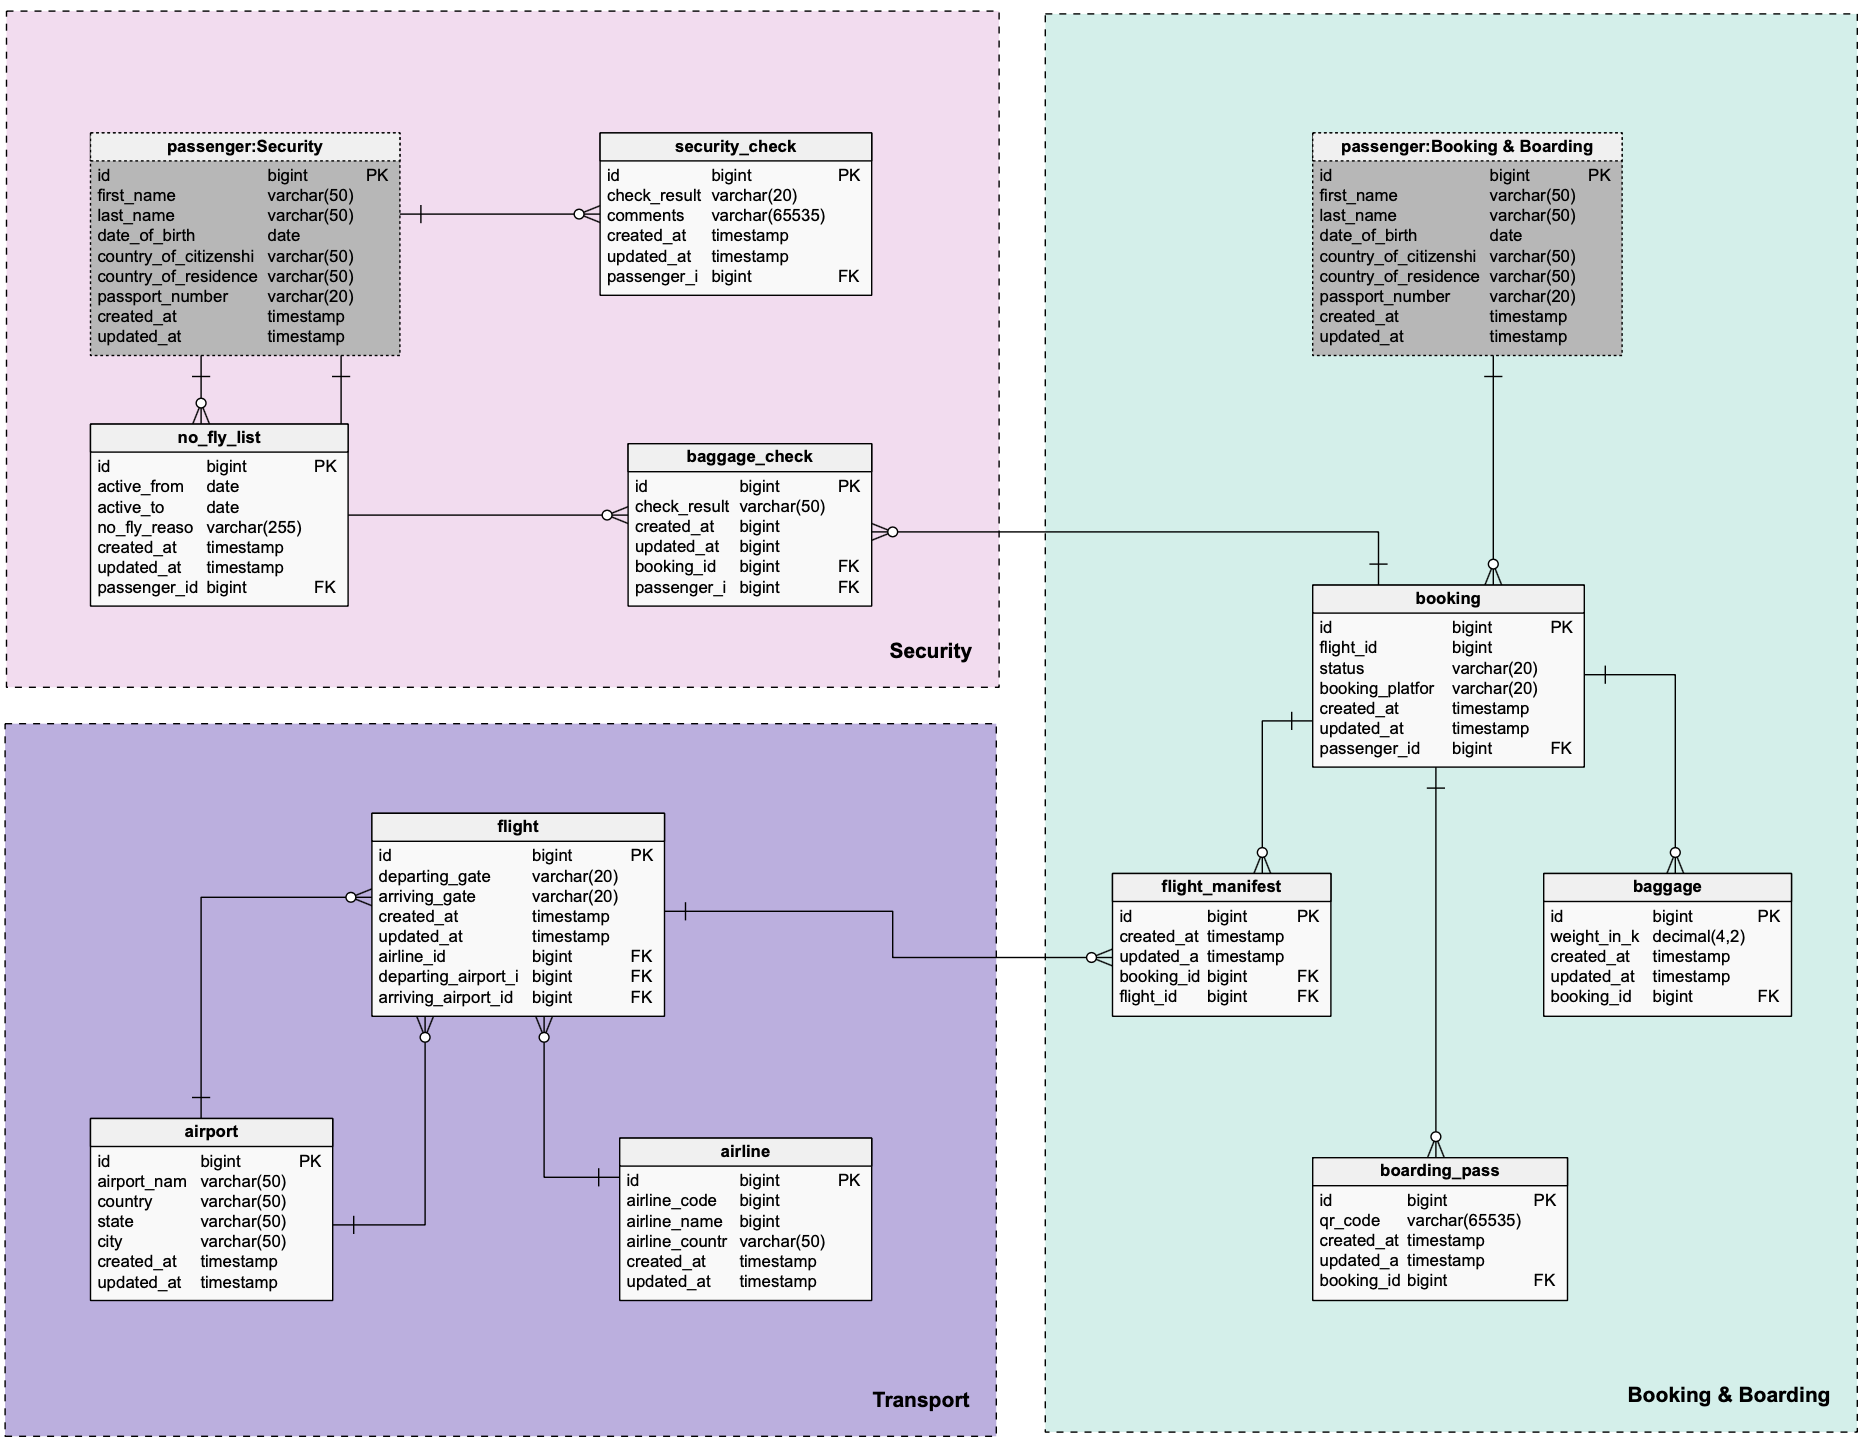
These formatting techniques allow you to make the model look better and efficiently organize the space.
7. Add Notes to Your ER Diagram
Complex ER diagrams also pose another problem: It’s often difficult to understand the context behind a table, a column, or any other type of database object. Adding a note on the reasoning behind your decision – why you chose a specific data type, etc. – will prove extremely helpful to the viewer.
Notes are a Vertabelo-specific feature. Leaving a note is different from adding comments as part of the database DDL. Combined, both of these features significantly help the consumers of ER diagrams and SQL data models.
Like many other Vertabelo features, notes can be used in different ways. You can use them to point out a problem, mark a table containing critical PII (personally identifiable) data, or add general information about the model. In the following ER diagram, we’ve used three examples of notes: the first note suggesting a future improvement, the second note explaining what the subject area does, and the third note identifying a table storing sensitive information.
Learn More Ways to Organize Your ER Diagram in Vertabelo
With these tips, you’ll be able to make your ERD diagrams more efficient as well as more visually appealing. This list is by no means exhaustive; there are many more Vertabelo features you can utilize to improve your ERD models. You can learn more about Vertabelo features on our blog and in the official documentation.
