

Online systems tend to track user’s actions. Gathering information about users’ behavior can increase the quality of their experience, which can lead to increased business income. In this article, we will show how to reimplement an existing Postgres database to a more complex analytics database like Amazon Redshift.
The solution we want to reengineer is a tracking system for an online SQL learning platform like LearnSQL.com.
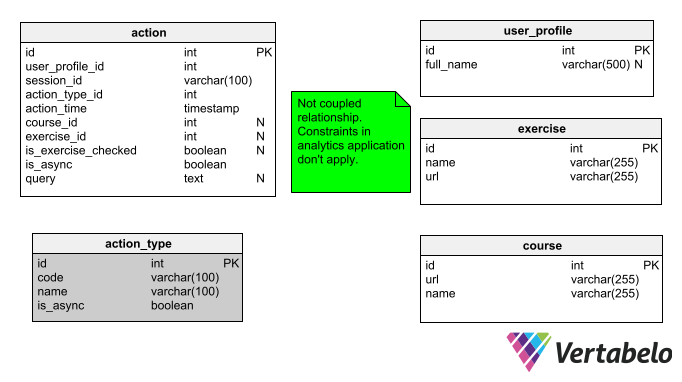
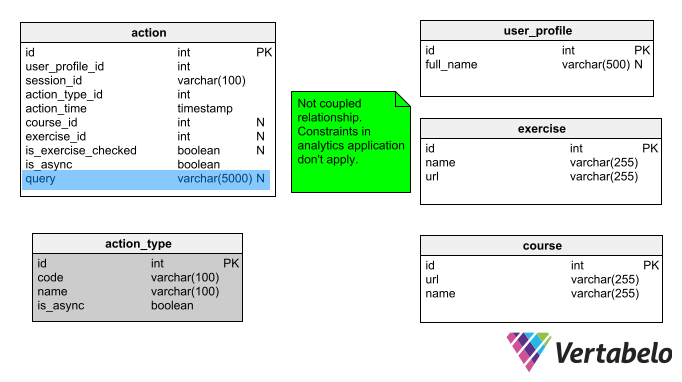
The source implementation is built on a PostgreSQL database and contains two main tables:
The source implementation is built on a PostgreSQL database and contains two main tables:
action– Tracks all users actions. Each record contains:user_profile_id– A unique identifier for each user.session_id– An identifier for each unique learning experience.action_time– The timestamp when this action occurred.course_id– The course being taken by the user when the action occurred.exercise_id– The exercise being completed by the user.is_exercise_checked– A true/false value that indicates if the exercise required user interaction.is_async– Not important for the purpose of this article.query– The SQL query which the user entered to complete the exercise.
action_type– A dictionary table containing three unchanging columns (id,code, andname). It stores many kinds of possible user actions, the most important of which are:- login – The user logged into the system.
- logout – The user logged out of the system.
- logout_session_expired – The user’s session expired, i.e. there has been no action for more than a few minutes.
- course_start – When the first exercise in the course was completed.
- course_finish – When all the exercises in the course were completed.
- course_page_open – When a course’s page was opened.
- exercise_page_open – When an exercise’s page was opened.
- execute_exercise_code – When the user executed some SQL code.
- successful_exercise_code_execution – Indicates if the user finished the exercise.
- failed_exercise_code_execution – Indicates if the user failed to finish the exercise.
This information allows analytics operators to track the time spent by users. For example, the following SQL query returns the overall time spent by a user and the average session length:
with user_sessions as (
   select
       user_profile_id,
       session_id,
       extract(epoch from max(action_time)) - extract(epoch from min(action_time)) as session_duration
   from action
   group by user_profile_id, session_id
)
   select
       user_sessions.user_profile_id,
       sum(user_sessions.session_duration) as total_time_spent,
       avg(user_sessions.session_duration) as session_avg_duration
   from user_sessions
   group by user_sessions.user_profile_id
The above query uses the WITH clause. First, we select users' sessions as a time between the last action max(action_time) and the first action min(action_time) as the scoped view user_sessions. The view is then used in the final query, where the SUM() of the total time spent and the AVG() session time are calculated for each user.
The result for this query is:
 user_profile_id | total_time_spent | session_avg_duration
-----------------+------------------+----------------------
            1000 | 20840.9749999046 |     378.926818180084
            1001 | 28607.1910002232 |     715.179775005579
(...)
           24732 | 1805.22199988365 |     902.610999941826
           24733 | 1567.03800010681 |     1567.03800010681
           24734 | 1686.83699989319 |     1686.83699989319
(23629 rows)
This result will be used to verify if the migration succeeded.
Exporting Data from Postgres
One of the first steps required to migrate one analytical system to another is to export the data gathered. Postgres allows us to export data in many formats. I have chosen CSV files because they are easy to upload to Redshift through Amazon’s popular S3 service. Note:
Redshift reads CSV files without a header line.
To export the tables action and action_type to CSV files, we execute the following commands:
$ psql -h host -d db
db=> \copy action to 'action_type.csv' delimiter ',' CSV;
db=> \copy action to 'action.csv' delimiter ',' CSV;
Changing to a Redshift Model
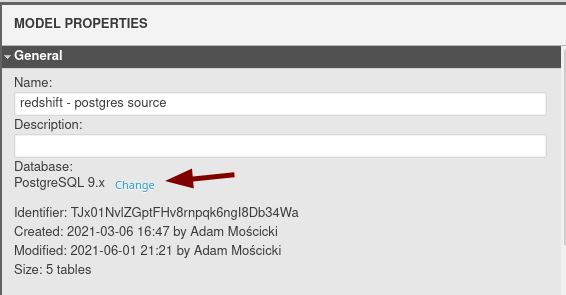
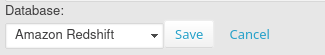
Switching between database engines is quite easy in Vertabelo. The process has two steps:
- Change the engine using Model Properties (look in the right pane). See the screenshot below:
- Fix any data types that don’t exist in the target database engine. In our case, we got:
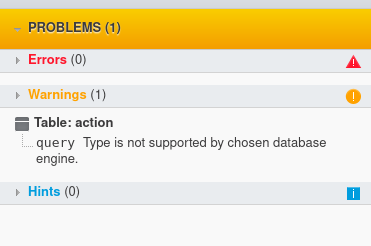
Note that the model validation has indicated the query column has an invalid data type (TEXT). For the purpose of our problem, I have changed this column’s data type to VARCHAR(5000). It now looks like this:
Importing Data to Redshift
Let’s assume that we have an instance of the Redshift up and running. More details can be found in our previous article What is Amazon Redshift?.
Generate DDL and Create Schema
First, we need to execute the DDL script (which Vertabelo automatically generated) in the Redshift database:
-- Created by Vertabelo (http://vertabelo.com)
-- Last modification date: 2021-08-24 15:07:44.976

-- tables
-- Table: action
CREATE TABLE action (
   id int  NOT NULL,
   user_profile_id int  NOT NULL,
   session_id varchar(100)  NOT NULL,
   action_type_id int  NOT NULL,
   action_time timestamp  NOT NULL,
   course_id int  NULL,
   exercise_id int  NULL,
   is_exercise_checked boolean  NULL,
   is_async boolean  NOT NULL,
   query varchar(5000)  NULL,
   PRIMARY KEY (id)
) ;

-- Table: action_type
CREATE TABLE action_type (
   id int  NOT NULL,
   code varchar(100)  NOT NULL,
   name varchar(100)  NOT NULL,
   is_async boolean  NOT NULL,
   PRIMARY KEY (id)
) ;

-- End of file.
Then we connect to the CLI and execute this script:
./usql redshift://redshift-test-cluster.<hidden>.redshift.amazonaws.com:5439/dev
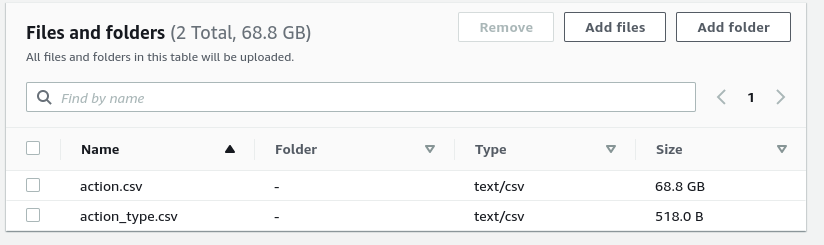
Import CSVs into S3 Bucket
Now we need to import the CSV into an S3 bucket. We’ll use a traditional method – a website form that uploads CSV files into a bucket.
To allow Redshift to read from S3 buckets, we need to create an appropriate role first. Based on current AWS documentation, we create a role named RedshiftCopy with the AmazonS3ReadOnlyAccess policy enabled. Then we associate it with a Redshift cluster. This role allows Redshift to use a COPY command on S3 files.
Import CSVs into the Database
With the tables created and the data ready in a S3 bucket, we can copy the data into a cluster:
- To copy data into the
actiontable:
COPY action
FROM 's3://postgres-redshift-import/actions.csv'
credentials 'aws_iam_role=arn:aws:iam::<RoleID>:role/RedshiftCopy'
CSV;
- To copy data to the
action_typetable:
COPY action_type
FROM 's3://postgres-redshift-import/action_type.csv'
credentials 'aws_iam_role=arn:aws:iam::<RoleID>:role/RedshiftCopy'
CSV;
Running Queries in Redshift
Thanks to the fact that the Redshift database is based on Postgres, queries which work inside Postgres also work in a Redshift cluster without any changes. We can execute our analytical queries with ease:
with user_sessions as (
   select
       user_profile_id,
       session_id,
       extract(epoch from max(action_time)) - extract(epoch from min(action_time)) as session_duration
   from action
   group by user_profile_id, session_id
)
   select
       user_sessions.user_profile_id,
       sum(user_sessions.session_duration) as total_time_spent,
       avg(user_sessions.session_duration) as session_avg_duration
   from user_sessions
   group by user_sessions.user_profile_id
   order by user_sessions.user_profile_id
And the result is:
 user_profile_id | total_time_spent | session_avg_duration
-----------------+------------------+----------------------
            2100 |            20841 |              	378
            2101 |            28610 |              	715
(...)
       	24732 |             1805 |                 902
       	24733 |             1567 |                1567
       	24734 |             1687 |                1687
(23629 rows)
Careful readers will notice that the result has different data types. In Postgres, the result contained decimal numbers; in Redshift, the numbers are integers. Those numbers (the second and third columns) represent users’ total time and average time spent (in seconds). For analytical purposes, the difference can be omitted. However, for learning purposes, we will explain where the difference comes from and how it can be fixed.
Investigating a Small Difference in the Result
By splitting queries into smaller parts, we found that extract(epoch) works differently in Redshift than in Postgres. For Postgres, the result is a decimal; for Redshift, it’s an integer:
postgres=> select
       user_profile_id,
       session_id,
       extract(epoch from max(action_time))
   from action
   group by user_profile_id, session_id limit 1;
 user_profile_id | session_id |   date_part
-----------------+------------+---------------
            2100 | s101964    | 1497006471.53
(1 row)

redshift=> (...)

 user_profile_id | session_id | date_part
-----------------+------------+------------
            2100 | s101964    | 1471338971
(1 row)
In Redshift’s extract function documentation, we find out that the return type is an INTEGER if the argument is TIMESTAMP, TIME, or TIMETZ; if the argument is TIMESTAMPTZ, the return type is DOUBLE PRECISION.
So, let’s change the action_time data type to TIMESTAMPTZ. We’ll create an action_tz table with the changed type:
CREATE TABLE action_tz (
   id int  NOT NULL,
   user_profile_id int  NOT NULL,
   session_id varchar(100)  NOT NULL,
   action_type_id int  NOT NULL,
   action_time timestamptz  NOT NULL,
   course_id int  NULL,
   exercise_id int  NULL,
   is_exercise_checked boolean  NULL,
   is_async boolean  NOT NULL,
   query varchar(5000)  NULL,
   PRIMARY KEY (id)
);
Next, we fill the table with the data we already have:
insert into action_tz select * from action;
Using this modified table, the result of our Redshift query is now exactly the same as in Postgres:
 user_profile_id | total_time_spent | session_avg_duration
-----------------+------------------+----------------------
            2100 | 20840.9749999046 | 	378.926818180084
            2101 | 28607.1910002232 | 	715.179775005579
(...)
           24732 | 1805.22199988365 | 	902.610999941826
           24733 | 1567.03800010681 | 	1567.03800010681
           24734 | 1686.83699989319 | 	1686.83699989319
(23629 rows)
Solved: Migrating an Analytics System from PostgreSQL to Redshift
We’ve successfully migrated Postgres-built analytics into Redshift in a few small steps. As shown in this example, using database design tools like Vertabelo makes the process much easier.
It’s worth mentioning that Redshift gave much faster results than our local machine. Considering the performance comparison will be the topic of our next Redshift article.
