

Get to know what an ER Diagram is through use cases and examples. Explore the notations for the essential components of an ERD.
Entity-relationship diagrams (ERDs) are used to visualize data and relationships among the entities of a system. At its core, an ER Diagram explains the logical structure and the flow of information within a data model. To do so, an entity-relationship diagram highlights entities, attributes, and relationships through predefined symbols for effective visualization of the architecture. Preparing an ERD is an essential first step towards designing a database, helping to analyze data flow and helping with due diligence of related system requirements.
When you Need an ER Diagram
An ER diagram is used to design database data models. If you are designing a new data model, preparing an ER Diagram helps with essential due diligence to capture and document system requirements. While in production, an ER diagram acts as a reference to improve database throughput, debug errors, and redesign architecture.
In addition to technical references, as ERDs are conceptual blueprint of the data flow within a system, they are also used to streamline business processes by identifying redundancies and bottlenecks within business entities.
In this article, we will go through a few ER diagram examples and how you can use Vertabelo to create ER diagrams to design efficient data models.
Objects in ER Diagrams
While there are several notations, the crow’s foot notation (also known as the information engineering notation or the IE notation) is prominently used in ER modeling due to its intuitive format and symbols. Let us delve into the representation of entities and relationships in crow’s foot notation to help model an ER diagram.
Entity
Entities represent data components within a database that could be living or non-living, real or abstract, so long as their data is stored in the database. Examples of entities include people, places, objects, events, or concepts. In ER diagrams, entities are usually depicted by rectangles, with the entity name at the top.
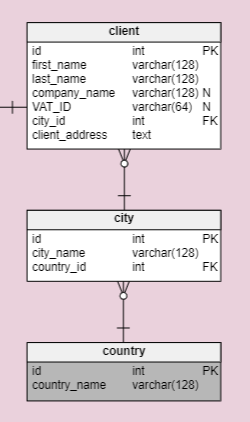
Client, City and Country Entities of a Data Model
Attribute
An attribute is a description of the properties of an entity or relationship. For instance, the entity shipment could have attributes such as shipment ID (id), client_id, shipment time_created, billing_address, etc. In the crow’s foot notation, an attribute is represented as a line of text in the lower compartment of the corresponding entity’s rectangle.
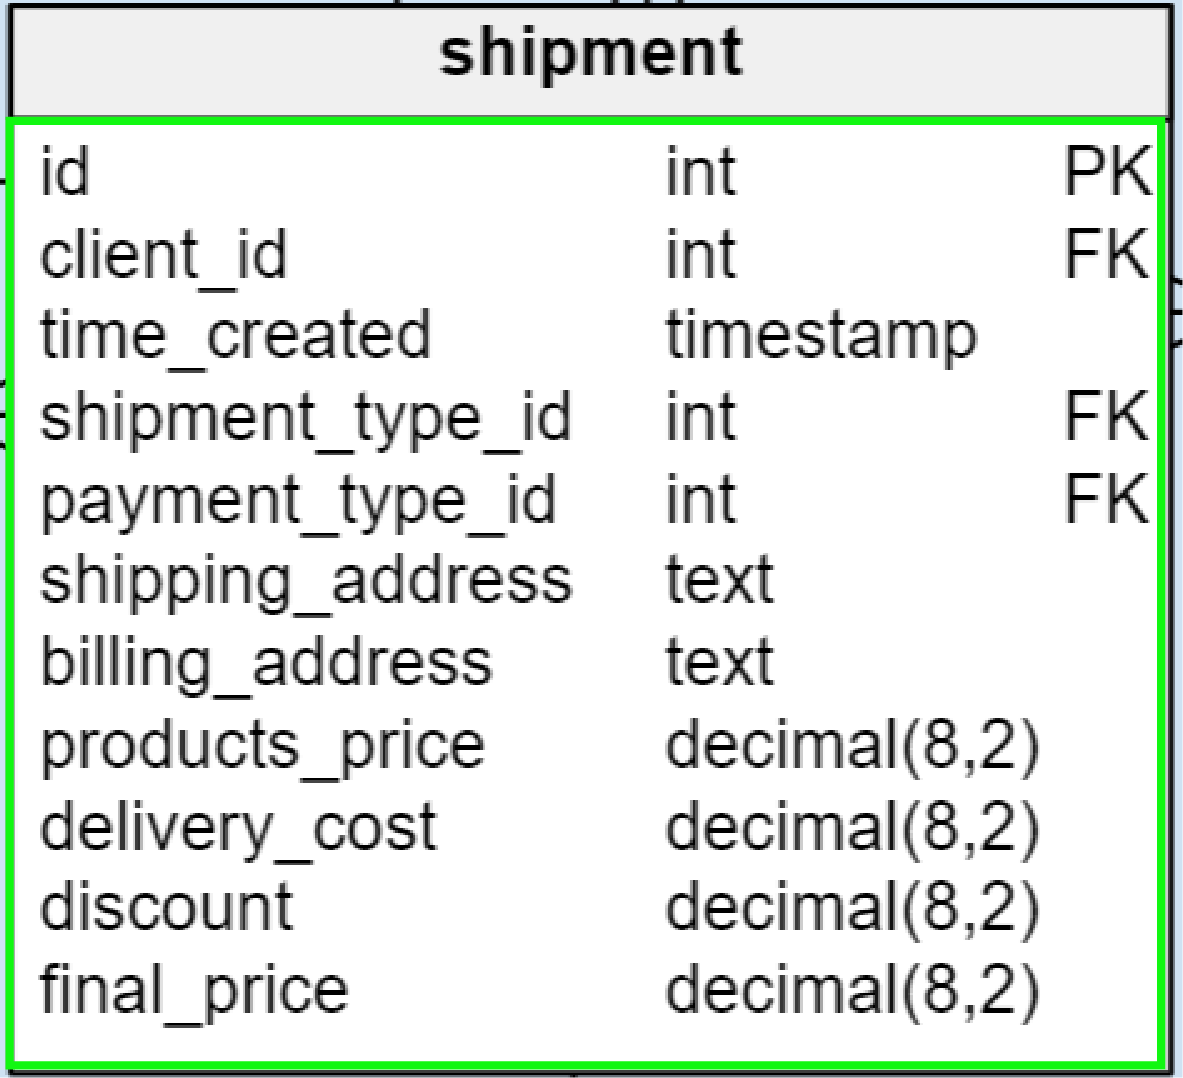
A Snapshot Showing Various Attributes of the shipment Entity
Relationship
A relationship denotes how various entities interact with each other. For instance, in a database for a vehicle hiring service, a customer will form a relationship with the entity vehicle through the act of selecting. “Select” is, therefore, a relationship between the two entities.
The relationship between data in one table and data in another table is called cardinality. Specifically, the cardinality indicates the number of times one entity in a table can relate with the instances of another entity.
When drawing relationships in crow’s foot notation, there are two indicators: one for multiplicity (cardinality) while the other indicates whether a relationship is optional or mandatory. A mandatory relationship is shown by a line perpendicular to the relationship line, while an optional relationship is shown by an empty circle.
When drawing relationships in crow’s foot notation, there are two indicators: one for multiplicity (cardinality) while the other indicates whether a relationship is optional or mandatory. A mandatory relationship is shown by a line perpendicular to the relationship line, while an optional relationship is shown by an empty circle.
In data modeling, there are three types of cardinalities.
One-to-One
In a one-to-one association, one entity in a table can relate only once to an entity in another table. For instance, a customer can hire only one vehicle at a time, and a vehicle can be assigned to only one customer at a time.
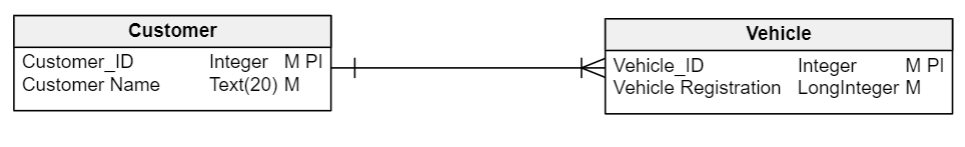
In an entity-relationship diagram, one row in one table would correlate to only one row in another table. In the IE notation, a mandatory one-to-one relationship is represented by two lines perpendicular to the relationship line near both entity rectangles.
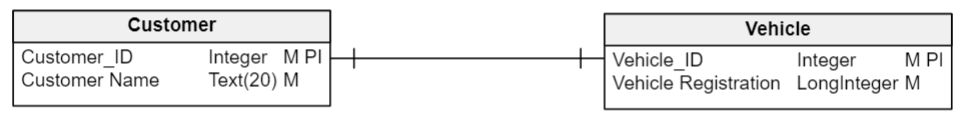
One-to-One Association With Mandatory Relationship
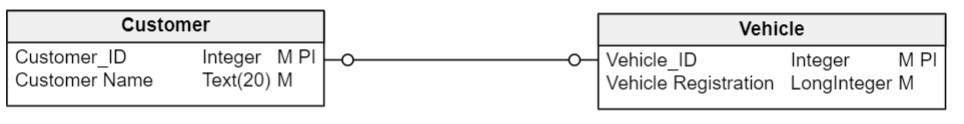
One-to-One Association With Optional Relationship
One-to-Many
A one-to-many relationship occurs when one instance of an entity can interact with multiple instances of another entity. For instance, one customer can hire several vehicles, while each vehicle can only be assigned to one customer at a time.
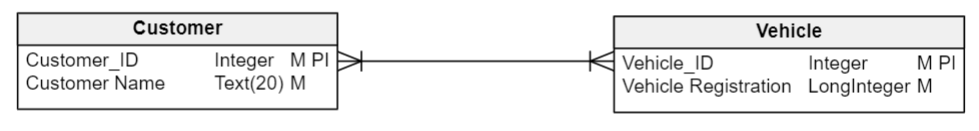
In the IE notation, a one-to-many relationship is represented by a single line at the end of the single instance, and a three-pronged crow’s-foot symbol facing the multiple instance rectangle.
One-to-Many Association With Mandatory Relationship
Many-to-Many
This type of cardinality occurs when multiple instances of one entity can relate with more than one instance of another set of entities. Imagine a scenario in which a customer could select multiple vehicles, and a vehicle could be leased by multiple customers within a certain time period. In the IE notation, a many-to-many relationship is depicted by crow’s feet at both ends of the relationship line.
Many-to-Many Association With Mandatory Relationship
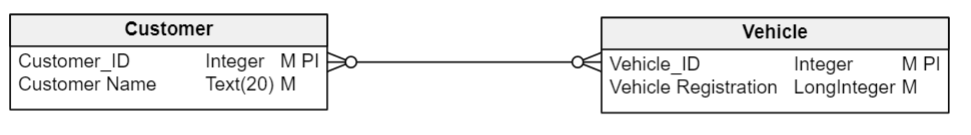
Many-to-Many Association With Optional Relationship
While the above notations are in crow’s foot notation, there are a number of other ERD notation formats, the details of which can be found here.
Types of Data Models
There are three types of data models in ER modeling.
Conceptual and Logical Data Models
The conceptual and logical data models describe how information is organized in a system regardless of the database used. The logical model specifies entities, attributes, and relationships between entities. It abstracts away from actual DBMS used in the implementation of the system.
Physical Data Model
The physical data model represents how the model will be built in the database. It shows the full table definition, including column names, column data types, table constraints, the primary key, the foreign keys, and the relationships between tables. The physical data model will be different for different RDBMS. For example, the data type for a given column may be different between MySQL and SQL Server.
This section appears incomplete. There is no explanation of what a conceptual model is (as opposed to logical). Also, the last sentence is incomplete.
How to Draw an ER Diagram
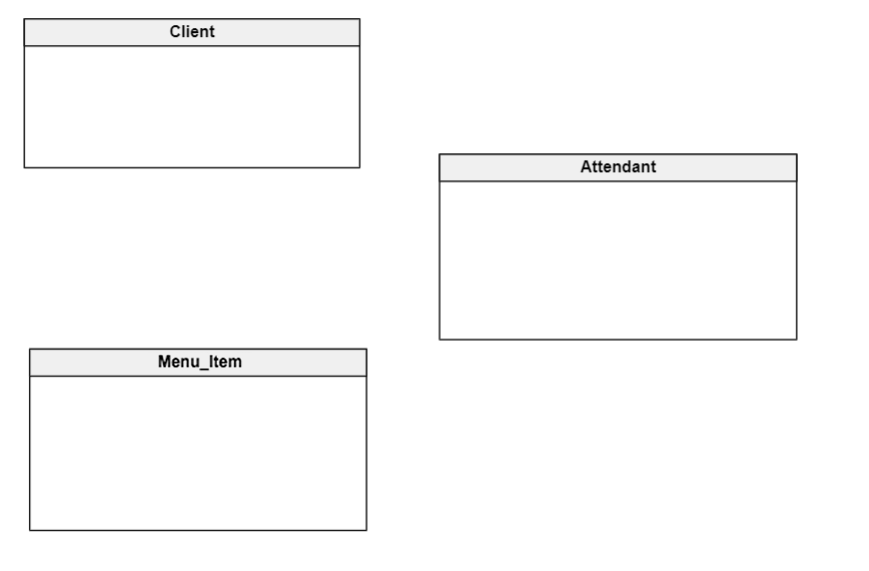
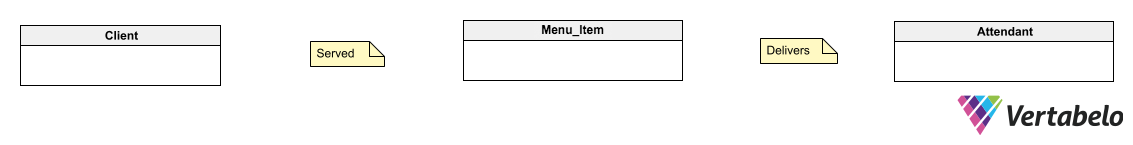
Let’s create an ER diagram for a data model using Vertabelo. Consider a simple scenario in which a client orders food at a restaurant. The client must purchase one or more menu items, while each menu item is served by one attendant.
1. First, identify the entities in your database. In this case, we have three entities: Client, Menu_Item, and Attendant.
2. The second step involves identifying the relationships between the selected entities.
- The
Clientis served aMenu_Item. - The
Attendantdelivers theMenu_Item.
3. The third step involves identifying cardinalities.
- A
Clientcan be assigned multipleMenu_Items. - An
Attendantcan only deliver oneMenu_Itemat a time before taking another order from the sameClient(assumption).
4. The fourth step is identifying entity attributes. Make sure that every attribute is mapped to only one entity; assign modifiers for those that belong to more than one.
Specify the primary key for each entity by using the most uniquely identifying attributes.
| Entity | Primary Key | Attribue |
|---|---|---|
Client | Client_ID | Client_Name |
Menu_Item | Menu_Item_ID | Menu_Item_Name |
Attendant | Attendant_ID | Attendant_Name |
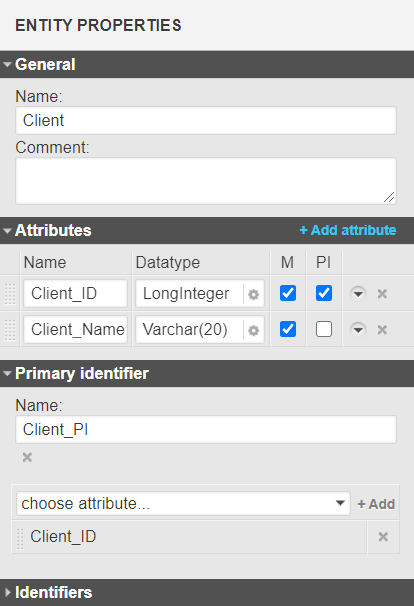
Setting the Attributes of an Entity Using the Vertabelo Property Editor
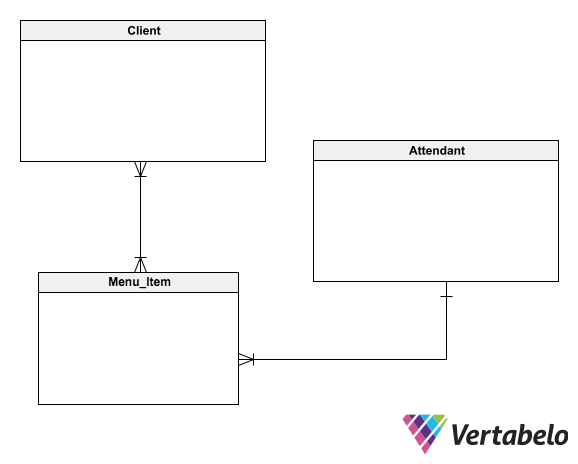
5. Once you have identified the entities, relationships, cardinalities, and attributes, you can now create your ER diagram. Here’s what our sample project will look like when designed using the crow’s foot (IE) notation.
Disclaimer: All the above diagrams were created using Vertabelo.
Data modeling challenges in the real world are often complex. Creating a precise ER diagram requires not only the right knowledge but also the right tools. Whether you are learning or designing a data model, Vertabelo acts as a great resource to your ERD designing needs. To find out more about Vertabelo features and how it can help, visit this article.
ER Diagram Example Use Cases
Let’s look at a few examples of the entity-relationship diagram to understand its use cases better.
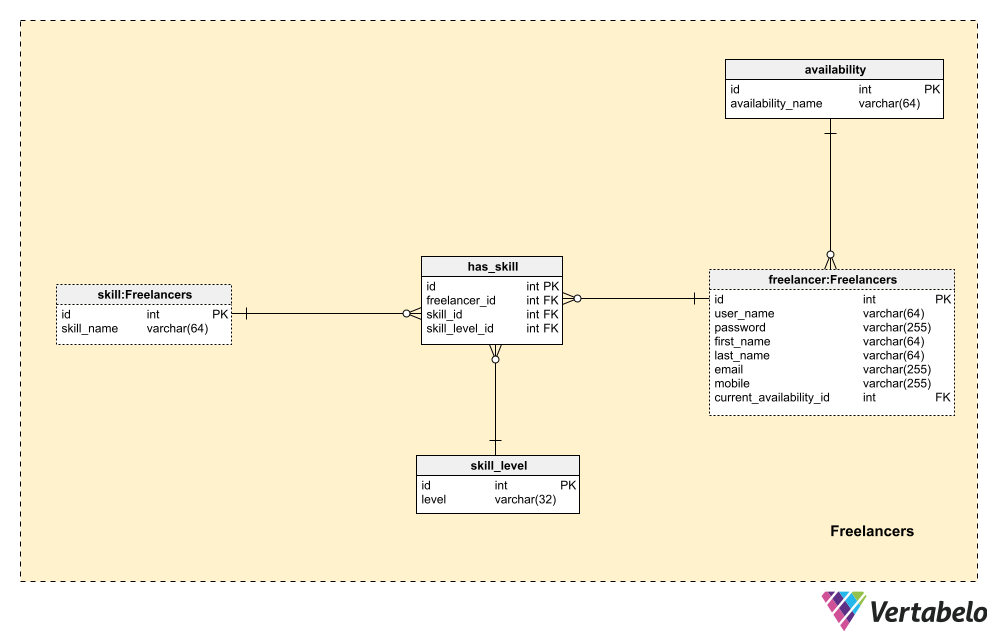
Use Case: Data Model for a Freelancers Collective
You can find a detailed discussion of this ER diagram in A Data Model for a Freelancers Collective.
This model shows the logical structure that can be used in large freelance projects that require collaboration between distributed teams. Since the freelance world connects professionals in a wide range of fields with varying skill sets, you will need a tool to orchestrate the interactions among freelancers, teams, and clients. Let’s consider the Freelancer Collective platform as a project management solution that helps connect various actors to collaborate on a number of projects.
Entities
Our model is broken into four main subject areas: Freelancers, Customers & Projects, Teams, and Project Phases.
The Freelancers section includes all the information provided by freelancers when they register to use the application. The information relevant to our database includes the freelancer’s skills, skill level, and skill sets. We also need to understand the freelancer’s availability to be sure that they can deliver an assigned project.
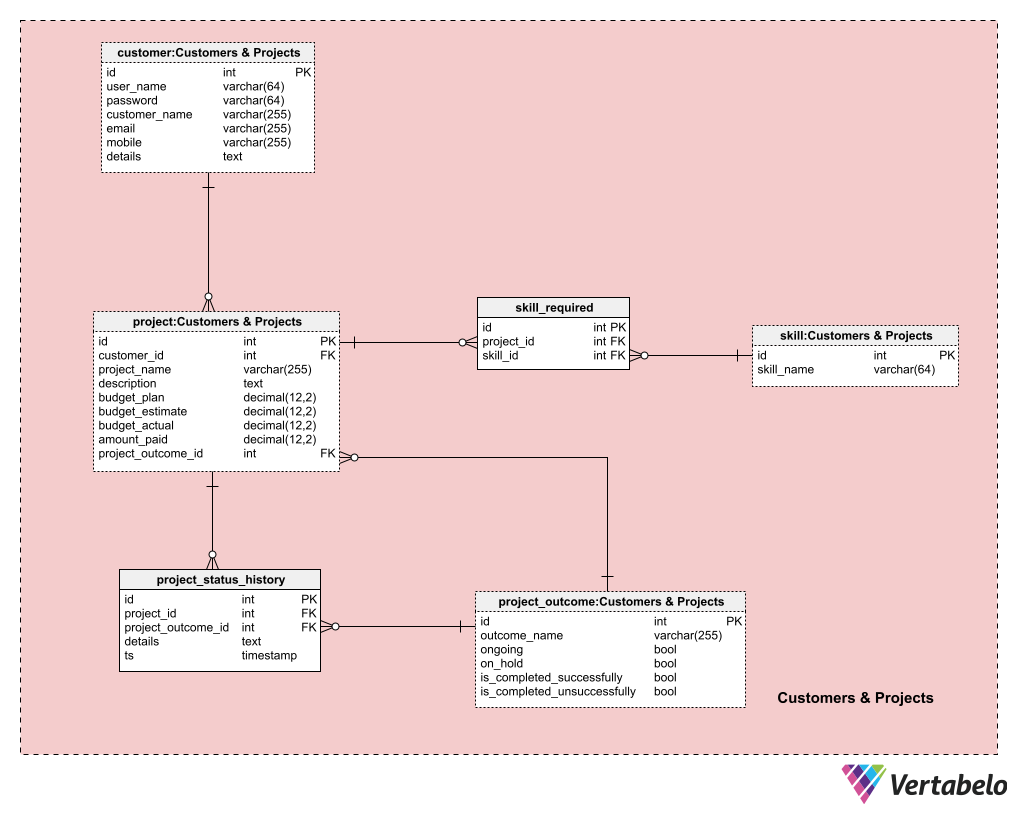
The second focus area is Customers & Projects. Customers use the system to upload their projects and connect with freelancers. This section includes the customer, project, project_status_history, skill, and project_outcome tables. Customers have also registered to use the application, and the system extracts their details from a special form. Project details are revealed when the client posts a project.
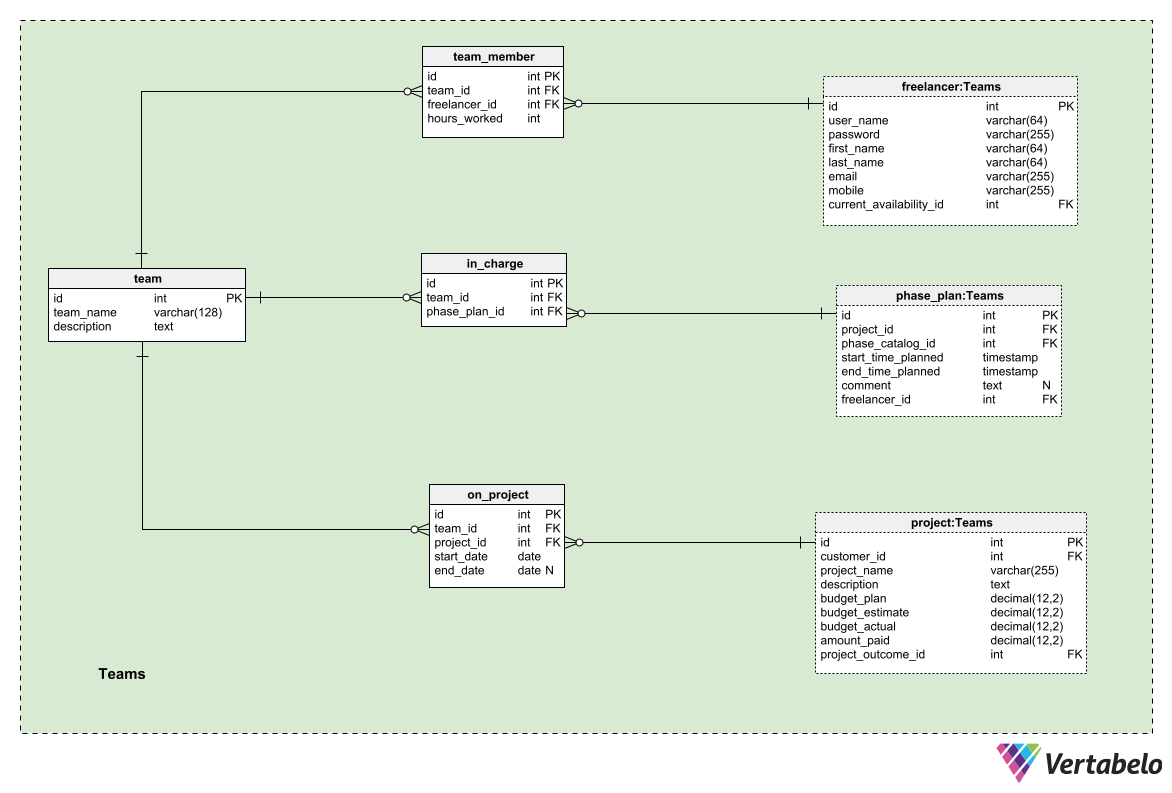
The third section is for the teams. This subject area forms a team and assigns them a project based on the freelancer’s ability and skill sets. The team is the major entity for this section. Other tables in this section include team_member, in_charge, freelancer, phase_plan, and project.
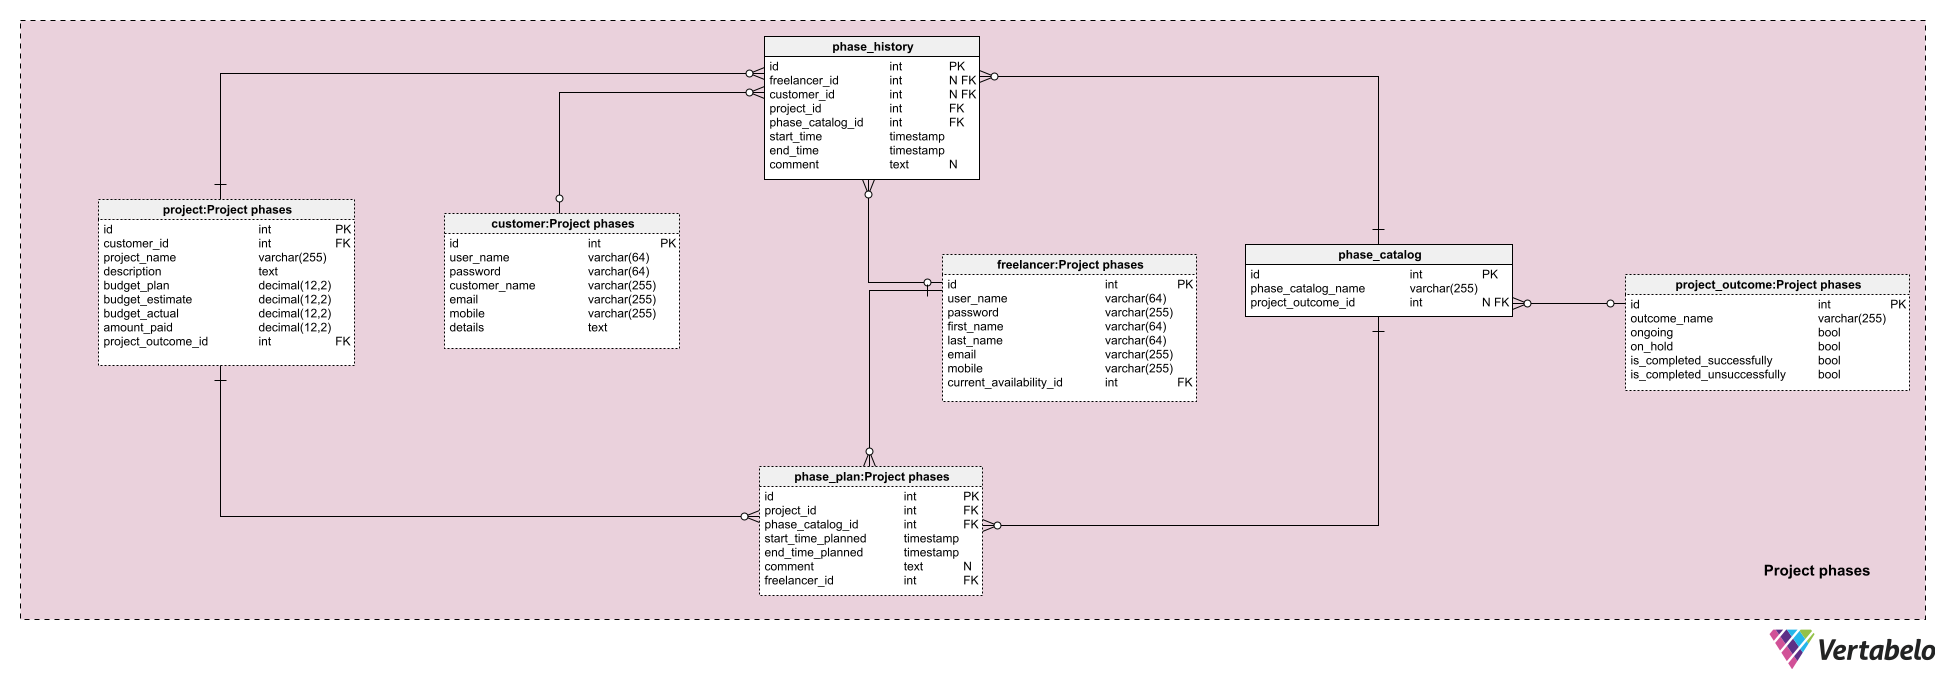
The final section involves the Project phases. Some entities in this section have appeared in other subject areas, and these include freelancer, customer, project_outcome, and project. The new entities in this set include phase_history, phase_catalog, and phase_plan.
Relationships
When a client posts a project, the system checks for the skill requirements and the availability of freelancers. The system then creates a team of freelancers who will collaborate on the project, which is now divided into phases. This system works as a supervisor, looking for the best collective that will work on a project, and assigning different project phases to different freelancers depending on the availability and skill level.
Collectively, this is how the data model can look:
Use Case: Peer-to-Peer Lending Data Model
You can find a detailed discussion of this ER diagram in A Peer-to-Peer Lending Platform Data Model.
Use Case: Peer-to-Peer Lending Data Model
You can find a detailed discussion of this ER diagram in A Peer-to-Peer Lending Platform Data Model.
Peer-to-peer lending refers to the practice of multiple lenders and borrowers transacting through a common platform. A peer-to-peer lending platform here essentially acts as a liaison between the parties to enable the process of lending, while ensuring necessary compliance and maintaining data security of all parties.
Let’s understand the data model by considering a scenario.
Entities
The entities are the following:
- A borrower requests a loan of a specific amount through the peer-to-peer lending platform after submitting details of his credit score, default history, tax returns, etc. Additional details of the loan may include repayment duration and preferred interest rate window.
- The lender(s) register(s) on the platform by entering its respective financial details, including KYC, tax returns, etc. It also enters its lending preferences, including the loan duration, interest rate, amount, borrower credit score, etc.
Relationship
The borrower asks for funding from an investor, who releases the funds through the loan fulfilment and repayment subsystem. This subsystem forms an associative relationship between the two entities.
The lending platform here essentially acts as the interface, connecting would-be investors with potential borrowers. This reduces the complexity of access to financing by allowing users to determine their own lending rates. The data model that can support this platform is outlined below:
An ER Diagram Is a Must
An ER diagram provides an easy way to represent your data model at a higher level of abstraction. With marked-up relationships among data sets, an ER diagram is perfect for process modeling and system debugging. In this article, we discussed the core concepts of ER modeling, with practical examples using Vertabelo for pragmatic experience. Whether you are learning or working on real-time data modeling, creating an ER diagram is a must.
