

When designing your dimensional model, it is worthwhile to watch out for mistakes that commonly occur during the process. Specifically, they can occur in the relationships between tables, both in fact-to-dimension and dimension-to-dimension relationships. In this post, we’re going to take a closer look at five common modeling mistakes and what you can do about them.
As you start a BI-related project, bulletproof dimensional design is hugely important. What makes a design bulletproof is the early mitigation of common design mistakes. In dimensional modeling, these errors are mostly tied to summary computations.
Summary computations (avg, sum, median, etc.) occur in drill-down (moving from a less granular view of data to a finer grain; moving in) and roll-up (moving from a more granular view of data to a less granular view; moving out) operations on data cubes. They also are found in join operations that combine fact and dimension tables. Bad summary computations can lead to:
- Incorrect results
- Errors in decision making
- Unusable performance optimizations
These problems occur repeatedly in different dimensional models across all industries. Let’s take a close look at each one and its related solution.
Dimension Summarizability Problems
We can classify dimensional modeling problems into two main categories: dimensional-related and fact-dimensional-related.
You will find dimensional summarizability problems (some would say “challenges”) in operations between dimensional tables. They are evident in the erroneous cardinalities of summarized data. We will look at three anti-patterns in data warehouse (DWH) modeling between dimension tables.
Our first two anti-patterns relate rolling up and drilling down operations in a DWH. The third involves problems with a many-to-many relationship between dimension levels. This usually occurs as an exception to a source system’s one-to-many relationship.
Anti-Pattern 1: Drill-Down IncomFive Common Dimensional Modeling Mistakes And How to Solve Thempleteness
Drill-down incompleteness is an exception (or exceptions) in the values of the source data. It’s not usually a design error. But this does not make it any less important to identify and remedy exceptions from the model. We can see an incompleteness when there is an inconsistency between the total shown and the drill-down value.
Drill-down incompleteness occurs when at least one of our parent table values does not have any values in the child entity. Summary calculations on parent table dimensional values yield different results than those done on child dimensional table values. They should be the same.
Note: Differing summary calculations on measures from the fact table are not erroneous if the connection to the fact table is only through a child table.
Example
In this example, we’ll focus on the relationship between the dim_sector dimensional table and the corresponding dim_department child dimensional table. Note the zero-to-many relationship on the child table. Therein lies the problem.
Model location: Article III: Common mistakes in dimensional modeling > DRILL DOWN INCOMPLETENESS
Although this is a valid modeling construct, we open the door to error in aggregation operations.
The fact table is connected to the dim_department dimension.
Let’s look at the data.
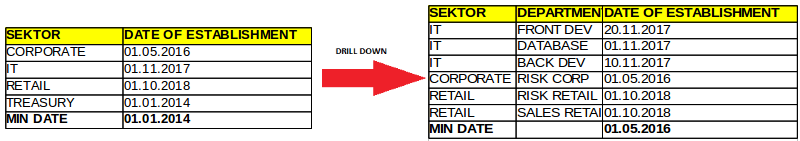
Picture 1: Drill-down incompleteness
Moving from left to right, we drill into the data values of all the sectors.
When we look at the data, we see that the minimal date value on the parent sector table is different than the minimal date value on the child department table. This is because treasury values are not decomposed in the department table (as other sectors are).
How to Resolve Drill-Down Incompleteness
The solution to this problem is simple and straightforward. We need to add a default value for the parent in the child entity and create a connection between them.
In our example, we could add a default treasury value in the department dimension. Another solution – the more common one – is to add a default value for all unallocated sectors.
Anti-Pattern 2: Roll-Up Incompleteness
Roll-up incompleteness is the reverse of drill-down incompleteness. Moving from a more granular child dimensional table to a less granular parent table, we get a smaller total. This total indicates that not all child values are allocated to parent values.
Example
The fact table is connected to the child table in a typical snowflake schema. In this case, we have two dimensional tables: a child, dim_product, that represents the products of a retail store and a parent, dim_category, that represents product categories.
Model location: Article III: Common mistakes in dimensional modeling > ROLLUP INCOMPLETENESS
Notice the zero-to-one relationship on the parent table. Again, this is the problem. And again although this is a valid modeling construct, it opens the door to errors.
Let’s look at our data.
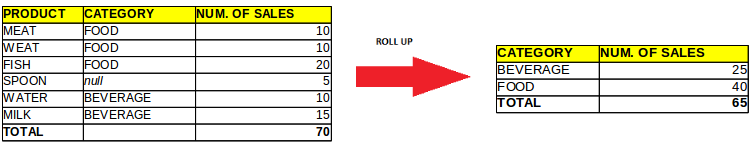
Picture 2: Roll-up incompleteness
The fact table, with its sales measurements, is connected to the dim_product dimension. Moving from left to right, we go from a finer grain to a coarser grain. We roll up the data.
Notice the difference in total values on different grain levels. This happened because the values of SPOON sales are not incorporated into any category.
How to Resolve Roll-Up Incompleteness
As roll-up and drill-down incompleteness are mirror images of each other, so are their solutions. We need to add a default value for the child entity to the parent entity, with a connection between them. In this example, it would be an unallocated category value.
Anti-Pattern 3: Non-Strict Dimension Relationships
This is another issue that we can easily identify. Unlike roll-up and drill-down incompleteness, a non-strict dimensional relationship problem is pure design error. Watch for it when there are many-to-many relationships in the model: non-strict problems usually occur when there are some exceptions to one-to-many relationships.
Note: The Vertabelo modeling tool does not allow many-to-many relationships. A good rule of thumb in dimensional modeling (and modeling in general) is to avoid many-to-many relationships. In this case, I will display the model with two one-to-many relationships.
Example
Let’s look at our example. We have a two dimensional tables: dim_month, which holds the months of a year, and dim_weekyear which holds the weeks in a year. The relationship is many-to-many because each month can have many weeks and one week can be in two months.
Base Model location: Article III: Common mistakes in dimensional modeling > NON STRICT DIMENSION
Let’s look at our data.
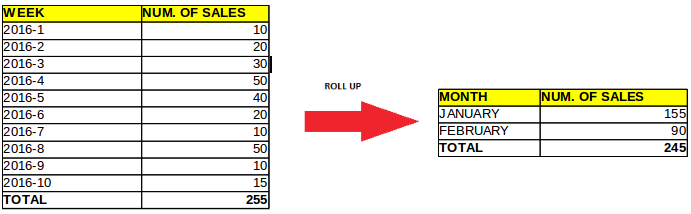
Picture 3: Non-strict Incompleteness
We represent the weeks of a year as a sequence of numbers and months in a year as a list of names.
The sum of data of sales in weeks is different than the sum of sales in months because there is an overlap in some weeks. This happens when a week falls into two months or when certain months are not in our data period (March). The data displayed is correct, but it is not roll-upable.
How to Resolve Non-Strict Dimension Relationships
We solve this error by placing the dimensions in different hierarchies. In our example, that would mean placing dim_month and dim_weekyear in different time hierarchies, with no relation to one another.
If we look at the model for this solution, we see two hierarchies which are independent of one and other. We mitigated the roll-up operation from week to month.
Model location: Article III: Common mistakes in dimensional modeling > RESOLUTION NON STRICT DIMENSION RELATIONSHIP
If the construction of different hierarchies is not possible, a major parent could be used instead of multiple parent values. For example, in the above case we would define one major category – the major parent – out of many categories.
Dimension-Fact Summarizability Problems
Dimension-fact summarizability problems are found in operations between fact and dimensional tables. Like dimensional summarizability problems, they are evident in the erroneous cardinalities of summarized data.
When looking at dimension-fact summarizability problems, we commonly see two modeling anti-patterns. The first relates to the joining of incomplete dimensional table data for all fact table values. The second relates to a non-strict relationship between values in fact and dimensional tables.
Anti-Pattern 1: Incomplete Dimension-Fact Relationships
Incomplete dimension-fact relationship problems manifest themselves in join operations between fact and dimensional tables. They occur when the fact table contains measures with no corresponding value in the dimensional table. Summary calculations on the fact table vary depending on the dimensional tables we are using for our calculation.
Example
In this example, we will look at a simple star schema with a central fact table, fact_account_snapshot, and three dimensional tables: dim_account, dim_customer and dim_time. You may have already noticed the incomplete relation to the customer table. As with the incomplete dimensional model, therein lies the problem.
Model location: Article III: Common mistakes in dimensional modeling > INCOMPLETE DIMENSION-FACT RELATIONSHIP
Let’s have a peek at the data. We’ll imagine that we need to roll up the data in two scenarios. In the first scenario, we must display the sum of all balances for customers on a monthly grain. In the second scenario, we must display the complete sum of all account balances on a monthly grain.
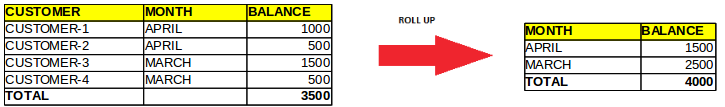
Picture 4: Fact dimension incompetents
In essence, we’re rolling up the data. As some customers in our fact table are not connected to the customer dimension table (i.e. anonymous or virtual customers), the total displayed varies between queries.
How to Resolve Incomplete Dimension-Fact Relationships
Unrelated fact entities should be connected to the default dimensional entity. In our example, that would mean creating a new CUSTOMER-VIRT value in the customer dimension.
Anti-Pattern 2: Non-Strict Dimension-Fact Relationships
This problem involves double counting measure values when a many-to-many relationship between the fact table and dimensional tables is present. It usually occurs when one event (i.e. a row in the fact table) is shared, in some business sense, between multiple parent entities in the dimensional table.
One more reminder: The Vertabelo modeling tool does not allow many-to-many relationships. So I will display the problematic model with two relationships, as I did earlier.
Example
We’ll return to our simple star schema. But this time, one account fact has many customers attached to it. (Let’s say they share ownership of the account.)
Model location: Article III: Common mistakes in dimensional modeling > NON STRICT DIMENSION RELATIONSHIP
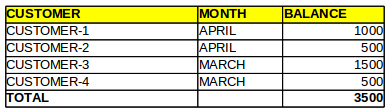
Now let’s look at the data. We have two scenarios; the first demands aggregation on the customer level for a set time period. The aggregated data is displayed as:
The second scenario requires us to aggregate data on the account level for the same time period. The data looks like this:
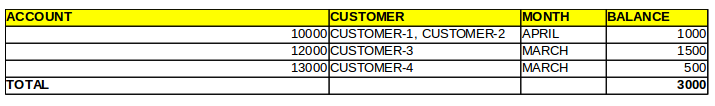
We can see the difference between totals of the same data range. Since customer-1 and customer-2 share the same balance (10,000), the error is in the double counting of the first scenario.
How to Resolve Non-Strict Dimension-Fact Relationships
Resolving this issue can be harder than resolving other relationship-type problems. If there are a limited or fixed number of many-to-many relationships in the source data, we can adjust our fact and dimensional tables. If the many-to-many relationships in the source system have a variable number of connections, a more complex solution is needed.
Limited Resolution
In this example, we know that account ownership is shared between only two clients. We can expand our model with an additional column to represent the second owner. We also can add a new relation to cover this new customer.
Model location: Article III: Common mistakes in dimensional modeling > RESOLUTION LIMITED NON STRIC DIMENSION-FACT RELATIONSHIP
Notice that this model covers only two possible owners; any more owners would require additional model changes.
Unlimited Resolution
A more general solution to our non-strict issue would be the construction of a new bridge table (which is actually a new fact table). This would bridge all possible owners in our model. Besides storing a list of account owners, we could use our bridge table to include any information relevant to the fact-to-dimensional relationship. In our example, this would be percent of ownership. So if different customers hold different percentages of ownership, this information would be seen in the perc_of_ownership column in our bridge_percent_ownership table.
Model location: Article III: Common mistakes in dimensional modeling > RESOLUTION UNLIMITED NON STRICT DIMENSION-FACT RELATIONSHIP
As we saw in this article, the resolution of most of the summarizability problems is conceptually simple. However, it undoubtedly leads to a more complicated ETL process. This is because we have to fill our dimensional model with multiple default values.
Remember, many-to-many relationships are a bad idea in OLTP and OLAP modeling design, so it is best to avoid them.
I will leave you with this thought: simplicity is the most important principle in data modeling. It should guide all your modeling endeavors. When you keep simplicity in mind, you’ll often see that common problems have simple solutions. Without simplicity, common problems have complex solutions.
We’ve covered just five anti-patterns. If you have found some interesting anti-pattern popping up time and again, tell us about it!
