

Lots of people use mobile weather apps to plan their day – or at least decide if they need to carry an umbrella! What sort of data model lies underneath these popular programs?
We all want to know how nasty the weather is before we step outside. Windows, iOS, and Android apps give us accurate and reliable information about current weather conditions. This article explains a detailed data model that could be used for such apps.
What Functionalities Does a Weather App Need?
Almost everybody who has a smartphone also has at least one weather app. These apps provide detailed weather information, which helps their users prepare for any weather changes they may encounter during the day.
What should a weather app do?
- Report current weather conditions, including the overall status (i.e. sunny, partially cloudy, cloudy, etc.) air temperature, humidity, wind speed and direction, a “feels-like” temperature, barometric pressure, and visibility. It should also report general information like sunrise and sunset times and the day’s high and low temperatures.
- Display hourly details (temperature, humidity, precipitation, overall weather condition) for the next 24 hours.
- Show a basic forecast (daily high and low temperatures, weather conditions, and sunrise/sunset times) for each day in the next week or two.
- Allow users to set their local city and any other cities where they want to see the weather.
- Let users to see data in the measurement units of their choice. For example, U.S. users would probably prefer Fahrenheit temperatures and wind speeds shown in miles per hour, but Canadian and European users would prefer Celsius and kilometers per hour.
Remember, the app is just showing the weather forecast and (depending on the settings) converting measurement units. It does not do the actual forecasting; it simply receives forecast data from another source (such as a government service or a weather forecasting agency) and displays it in the user’s preferred way.
The Weather App Data Model
I’ve split the model into three subject areas:
Weather LogsUser PreferencesUser Profiles
We’ll discuss each area in the order it is listed.
Weather Logs
This is the most important subject area. Any weather app should capture these basic details:
- Current actual temperature
- Current “feels like” temperature, which may be different than the actual temperature because of additional weather factors (e.g. high humidity can make a hot day feel hotter or a cold day feel colder).
- Daily high and low temperatures
- Dew point and/or relative humidity data
- Wind speed
- Wind direction
- Barometric pressure
- Visibility (i.e. a foggy day will have lower visibility than a clear day)
- Sunrise and sunset times
Together, these give a holistic view of current weather condition. This is the information that will be presented to users, usually through one or more intuitive screens.
There are two kinds of attributes to any weather forecast: ones that change each day and ones that change throughout each day. Attributes like sunrise and sunset times are based on events that happen once a day, so this information is captured once for each day. When it comes to long-range forecasts (from 7 to 15 days in advance) users should have enough info if you include each day’s high and low temperatures, humidity level, and overall weather conditions (i.e. sunny, cloudy, etc).
Attributes like current temperature, “feels like” temperature, wind speed and direction, barometric pressure, and visibility range can change throughout a day. These should be captured for a specific time interval, say every hour or every three hours. For the purposes of this model, we’ll assume a one-hour timeframe.
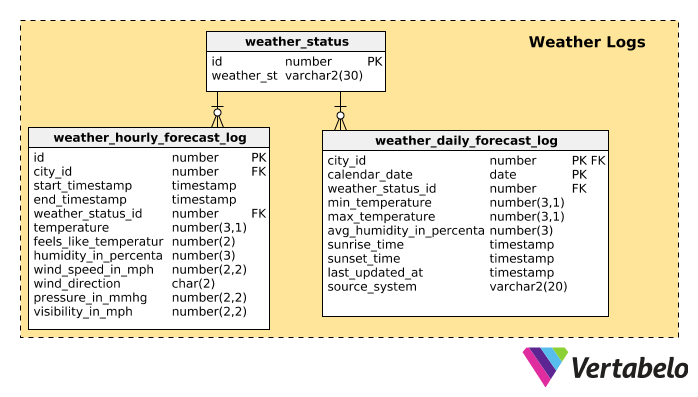
Because we have two types of attributes, I’ve put two tables in this subject area. The first, weather_daily_forecast_log, holds the daily attributes. It contains these columns:
city_id– References thecitytable and signifies the city to which this data applies.calendar_date– The calendar date for this data. Since this table holds one record per city per date, these columns (city_idandcalendar_date) form the composite primary key for this table.weather_status_id– References theweather_statustable and denotes the weather condition (i.e. rainy, cloudy, partly cloudy, or sunny).min_temperature– That day’s minimum (lowest) temperature.max_temperature– That day’s maximum (highest) temperature.avg_humidity_in_percentage– The average relative humidity in the air that day. (The amount of water that air can hold is relative to its temperature.)sunrise_time– A timestamp column that stores the sunrise time.sunset_time– A timestamp column that stores the sunset time.last_updated_at– Holds the date and time (as a timestamp) when the record was last updated.source_system– The name of the source of our weather forecast. These last two columns are kept for audit purposes.
The weather_hourly_forecast_log table holds all the attributes that can change throughout the day. We consider these attributes as one record for a specific timeframe. The columns are:
id– The surrogate key for the table.city_id– The relevant city.start_timestamp– A timestamp column that signifies when this timeframe started.end_timestamp– A timestamp column that signifies when this timeframe ended.weather_status_id– The overall weather status for the timeframe.temperature– The current temperature for the timeframe.feels_like_temperature– The “feels-like” temperature for the timeframe. This can be influenced by many factors, including wind, rain, and high or low humidity. This information gives a more realistic impression of current weather conditions.humidity_in_percentage–This column holds the amount (as a percentage) of humidity in the air.wind_speed_in_mph– Holds the wind speed in mph (miles per hour).wind_direction– This text column stores one or two characters that denote wind direction (N, NW, NE, S, W, SW, etc.)pressure_in_mmhg– Stores air pressure values, in mmHg.visibility_in_mph– Stores visibility range values, in miles.
These tables will hold the latest data for a particular timeframe. Occasionally, a future forecast can be issued and then later changed. In such cases, the existing record for the relevant day or timeframe will be overwritten by the latest one. Also, you’ll notice that we’ve only stored attributes in a one measurement unit (e.g. mph) per attribute. To save on storage, we will only store one record for each attribute and let the front end convert these to the user’s preferred units when necessary.
User Preferences
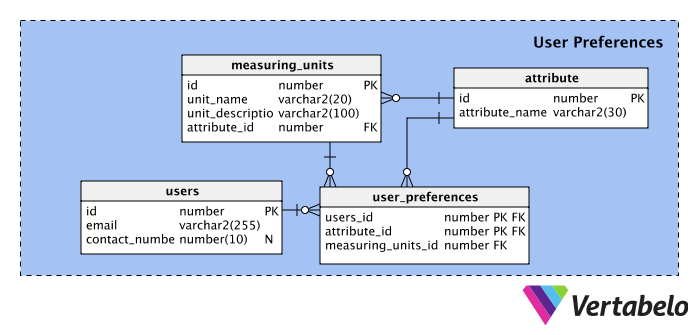
This subject area mainly handles user preferences for measuring units. Most of the columns are self-explanatory, so we will just briefly explain the purpose of each table.
The users table holds basic info about users, like email address and phone number. The id column assigns a unique number to every user who registers with the application.
The attribute table stores a list of attributes, like temperature, wind speed, wind direction, barometric pressure, etc.
The measuring_units table stores a list of all measurement units, with their corresponding name, description, and attribute_id.
The user_preferences table maps the relationship between users and measuring unit preferences. Note that we can store information about users’ preferences for each individual attribute. Since users can choose any one measuring unit out of the given options for an attribute, we have created a composite primary key using the users_id and attribute_id columns.
User Profiles
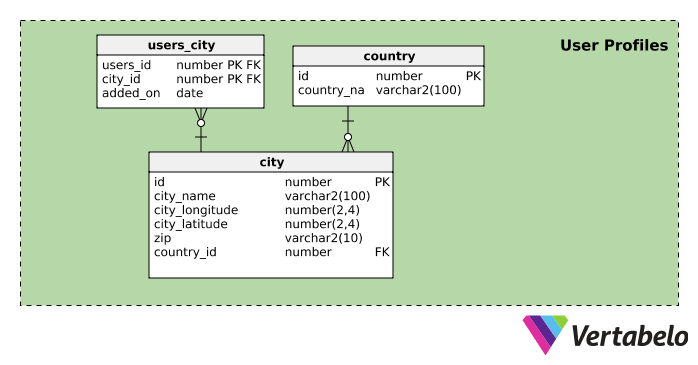
Since the application allows users to monitor the weather in as many cities as they want, this subject area handles associating one or more cities with each user profile.
The city table store a list of cities and their location details (postal code, country, map coordinates). The columns in this table are self-explanatory, but it’s good to realize that the city_longitude and city_latitude columns can hold positive or negative values.
The user_city table associates cities with user profiles. Since users can add a city to their profiles only once, we have created a composite primary key using the users_id and city_id columns.
What Would You Add to This Data Model?
Now we come to the section where you tell us what you would add, change, or delete in a model. What might we add? Well, global warming has become a big concern. Research clearly shows that it is caused more by human activities than natural changes. However, relatively few people realize this. How can we make people aware of climate changes and global warming? We could include facts about environmental changes and their causes on the app. Or maybe we could include the percent of tree cover in a local area to raise awareness.
What do you think? Please let us know your ideas by commenting below.
