

An ER diagram is a database blueprint. It facilitates data visualization and database development processes. Read on to find out what ER diagrams are and how to create them in Vertabelo.
In this article, we’ll explain what an ER diagram is and what elements it contains. We’ll discuss ER diagram abstraction levels, such as conceptual, logical, and physical diagrams. You’ll learn how to build ER diagrams using various notations, such as Crow’s Foot notation, Barker’s notation, and more. Finally, we’ll show you several examples of ER diagrams in Vertabelo.
Let’s get started.
What Is an ER Diagram?
An entity-relationship diagram (ER diagram or ERD) uses symbols to describe entities and the relationships between them. Let’s look at a simple example before jumping into definitions.
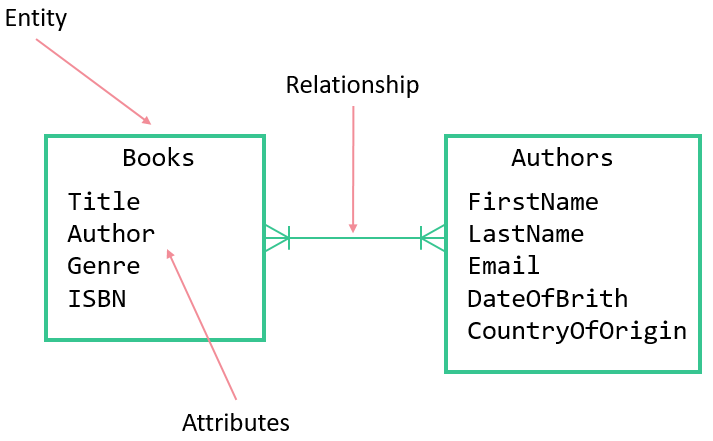
Here, the entities are Books and Authors. The attributes of the Books entity are Title, Author, Genre, and ISBN. The attributes of the Authors entity are FirstName, LastName, Email, DateOfBirth, and CountryOfOrigin.
Also, there is a many-to-many relationship between the Books and Authors entities; a book can be written by one or more authors and an author can write one or more books.
For more details, check out our earlier article on ER diagrams.
Abstraction Levels in ER Diagrams
There are three main levels of abstraction that ER diagrams usually follow (although sometimes the conceptual and logical levels are combined).
Conceptual ER Diagram
The conceptual diagram is the simplest version with the highest level of abstraction. Here we identify the entities (such as people, objects, or concepts) and relationships between them. The primary consideration at this level are business rules; technical terms come later.
Logical ER Diagram
The next step is the logical diagram. It is built from the conceptual diagram by adding attributes to each entity and detailing the relationships (i.e. by what will become primary and foreign keys in the database). But we are still not considering a specific database platform and its technical requirements.
Here is an article on the data types available in Vertabelo for logical models.
Physical ER Diagram
The physical diagram is created from the logical model; it is the most precise, technical, and detailed ERD. Here we consider the target database engine and its exact data types and other features. The entities and attributes turn into tables and columns, respectively; the many-to-many relationships require additional tables to store them.
The physical model can be turned into an SQL script for database creation.
To learn more about the abstraction levels of ER diagrams, read our article on conceptual, logical, and physical data models.
Let’s move on to the components of ER diagrams.
What’s In an ER Diagram?
Entities
Examples of entities include people, objects, or concepts. There are strong (independent) entities and weak (dependent) entities. A strong entity can exist on its own, but a weak entity is dependent on a strong entity and typically stores data associated with the strong entity. For example, a person entity is a strong entity; a person_details entity is a weak entity that extends the person entity.
Also, you may come across associative entities, which create associations between entities (i.e. storing data for a many-to-many relationship).
Here is an example of entities (without attributes) in a logical model:
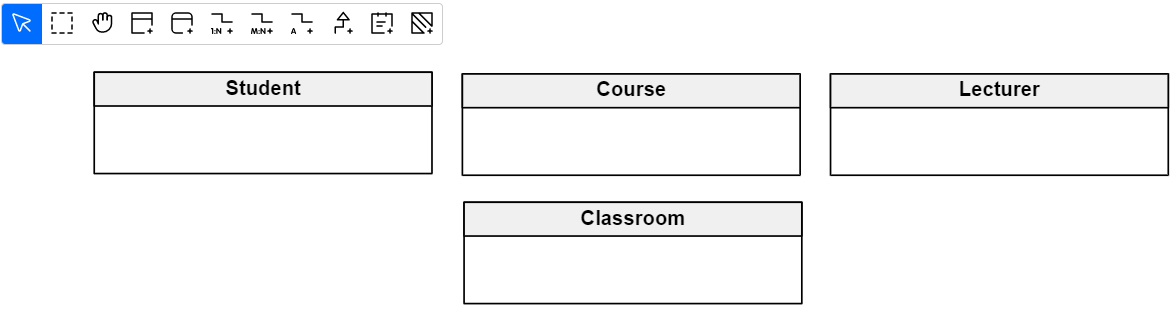
In physical models, entities turn into tables that store data within a database.
Attributes
Each entity contains a list of attributes. Attributes are characteristics that describe an entity. For example, a Student entity may contain the attributes StudentID, FirstName, LastName, and Email.
Here is an example of attributes in a logical model:
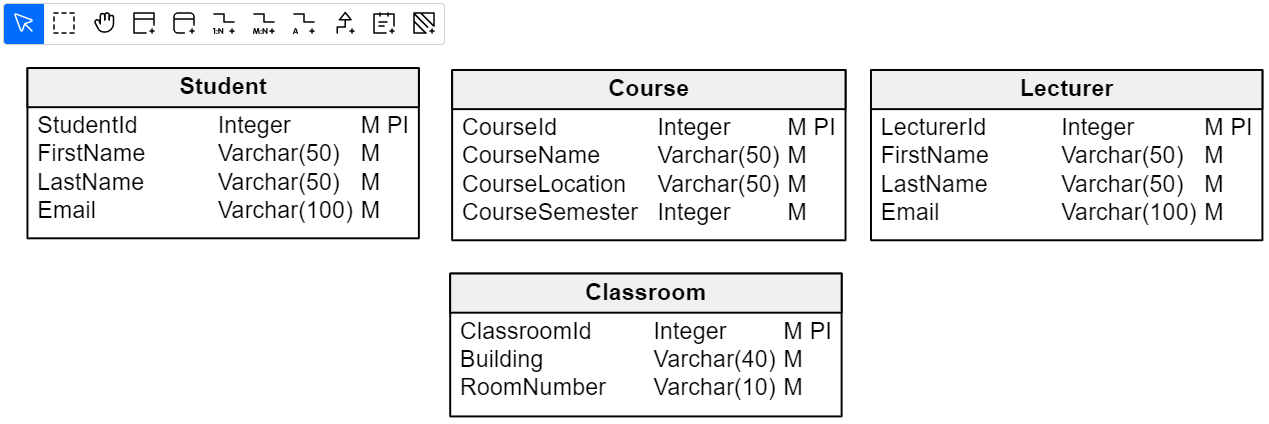
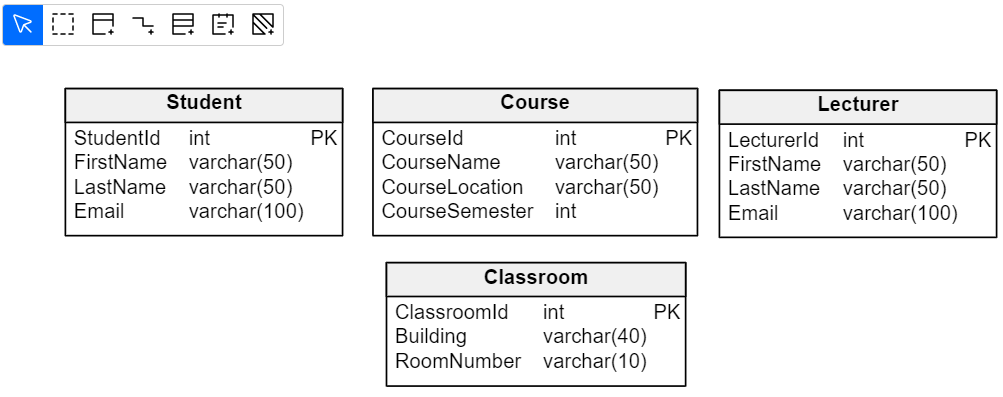
In physical models, attributes turn into table columns within a database:
You can learn more about the difference between entities and attributes elsewhere in our blog.
ER diagrams also show the relationships between entities, but these are a bit more complex than entities and their attributes.
Relationships in ER Diagrams
A relationship is a link between two entities. It defines how these entities are related to each other. Each relationship has a cardinality that indicates how many objects of one entity relate to how many objects in the other entity. Examples of cardinality include one-to-one, one-to-many, and many-to-many. Relationships between entities can also include inheritance or associations with their cardinalities.
Types of Cardinality
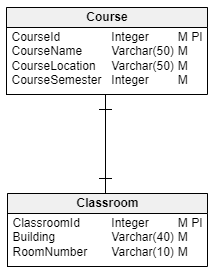
- One-to-one (one entity object relates to one or zero objects):
- Both entities are mandatory: Each course has one classroom, and each classroom has one course.
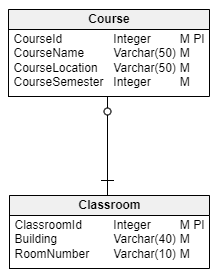
- One of the entities is optional: Each course has one classroom, but each classroom may or may not have a course.
- One-to-many (one entity object relates to one, many, or zero objects):
- Both entities are mandatory: Each course has one lecturer, and each lecturer can have one or more courses.
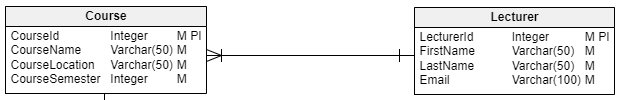
- One of the entities is optional: Each course has one lecturer, but each lecturer can have zero or more courses.

- Both entities are mandatory: Each course has one lecturer, and each lecturer can have one or more courses.
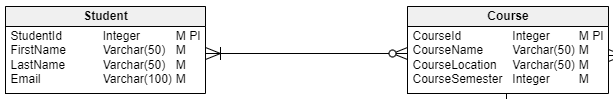
- Many-to-many (multiple entity objects relate to zero, one, or many objects):
- Both entities are mandatory: Each course has one or more students, and each student attends one or more courses.

- One of the entities is optional: Each course has one or more students, but each student can attend zero or more courses.
- Both entities are mandatory: Each course has one or more students, and each student attends one or more courses.
Types of Relationships
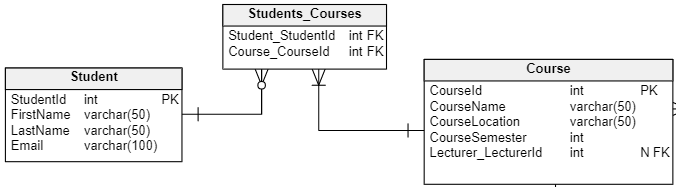
- Associations:
The association relationship assigns a row from one table to a row from another table, including the cardinalities. Here, each student can be signed up for zero or more courses and each course can have zero or more students.
- Inheritance:
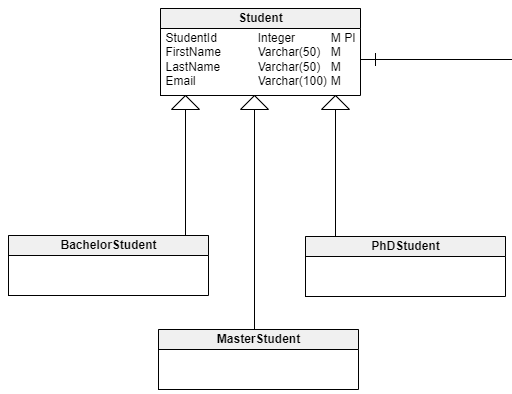
The inheritance relationship creates a parent-child relationship between tables. This is where attributes of a parent table are inherited by a child table (in addition to the child table’s own attributes). Here, the Student table is a parent table to the BachelorStudent, MasterStudent, and PhDStudent tables.
Physical models are similar, except that the many-to-many relationship requires an additional table to store the relationship data.
- Both entities are mandatory: Each course has one or more students, and each student attends one or more courses.
- One of the entities is optional: Each course has one or more students, but each student can attend zero or more courses.
ER Diagram Notations
Vertabelo uses various notations to ease the process of diagram creation and enhance the readability of diagrams. All notations use symbols to represent ERD entities and relationships – e.g. boxes to represent entities and lines to represent relationships. But the details are different for each one, so let’s go through each notation.
Crow’s Foot Notation
In addition to laying out entities and defining relationships, Crow’s Foot notation allows you to define the multiplicities (or cardinalities) of the relationships between the entities.
Here are the available multiplicities:
- A zero-or-one multiplicity defines an optional relationship.
- A one-and-only-one multiplicity defines a singular relationship.
- A zero-or-many multiplicity defines an optional relationship.
- A one-or-many multiplicity defines a singular or plural relationship.
A line connecting two entities can have either of the abovementioned multiplicities at each end.
Here are more elaborate examples of Crow’s Foot notation.
Examples in Vertabelo
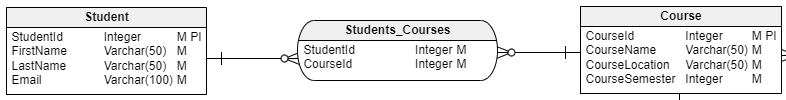
Here is an example of a logical ER diagram in Crow’s Foot notation:
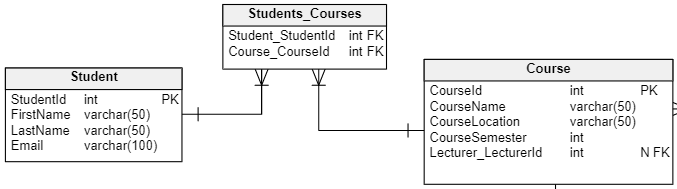
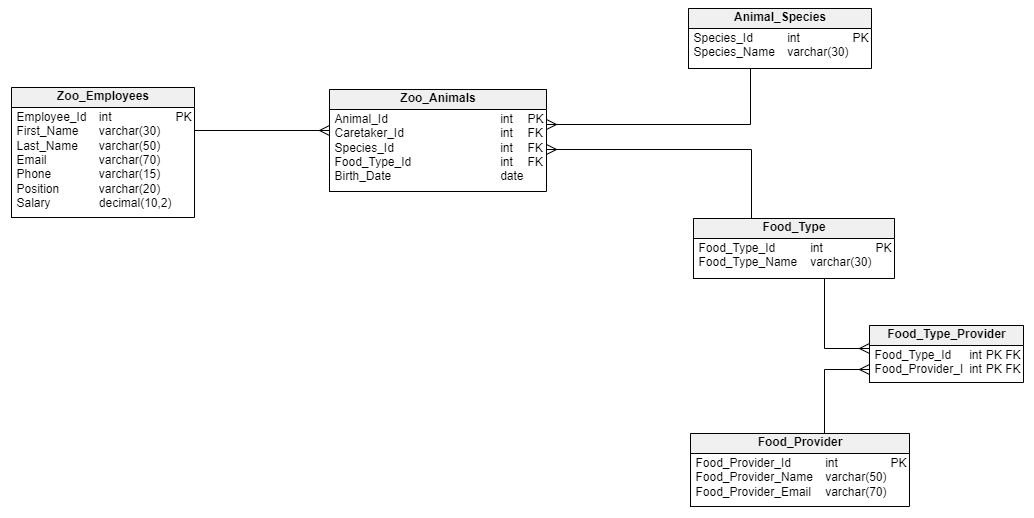
Here is an example of a physical ER diagram in Crow’s Foot notation:

Barker’s Notation
Barker’s notation defines the implementation details for entities, attributes, and relationships. Let’s look at the details of this notation scheme.
- Entities are represented as rectangular boxes with the entity name at the top. And attributes are grouped according to their roles, such as a unique identifier (#), mandatory field (*), and optional field (O).
- The relationships between entities are defined as mandatory (represented by a straight line) or optional (represented by a dashed line).
- As in Crow’s Foot notation, Barker’s notation defines multiplicities. However, Barker’s notation offers just three types of relationships (as opposed to Crow’s Foot notation, where you can mix and match four different multiplicity types). These three types are one-to-one (represented by a straight line), one-to-many (represented by a straight line with a triangle at one end), and many-to-many (represented by a straight line with triangles at both ends).
- Barker’s notation offers a way to define primary and foreign key relationships. When the primary key of one table is a foreign key in another table, it is represented by the UID bar. It is defined somewhat like the one-or-many relationship in Crow’s Foot.
- This notation also uses non-transferability of relationships to mark permanent relationships between entities/tables. It is represented by a rhombus drawn at the end of the connecting line.
- Inheritance is implemented as When a certain entity has several subcategories, you can use subtypes to define them all within the parent entity.
Here are more details about Barker’s notation.
Examples in Vertabelo
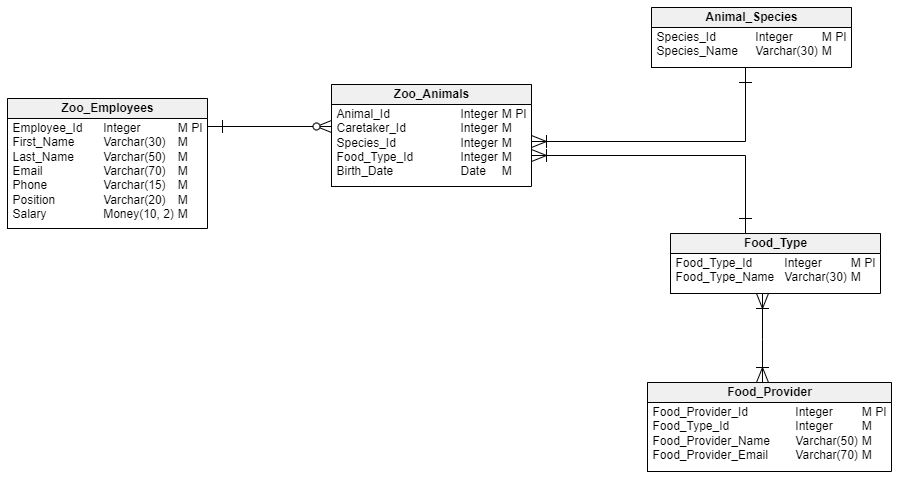
Here is an example of a physical ER diagram in Barker’s notation:
Unified Modeling Language
UML is a popular modeling language used throughout the computer science world. Let’s see how it defines diagram symbols:
- An entity is a rectangle, as before.
- Relationship multiplicities are defined by writing a number range at each end of the line connecting the entities.
- Inheritance is defined using an empty arrow sign that goes from child entities to a parent entity.
- Aggregation defines the relationship between a component and the whole to which it belongs. (In this case, a component may exist on its own.) The symbol used is an empty diamond.
- Composition defines the relationship between a component and the whole to which it belongs. Here a component cannot exist on its own. The symbol used is a black diamond.
- Both aggregation and composition relationships may include multiplicities defined earlier.
To learn more, visit our article on UML notation.
Examples in Vertabelo
Here is an example of a logical ER diagram in UML notation:

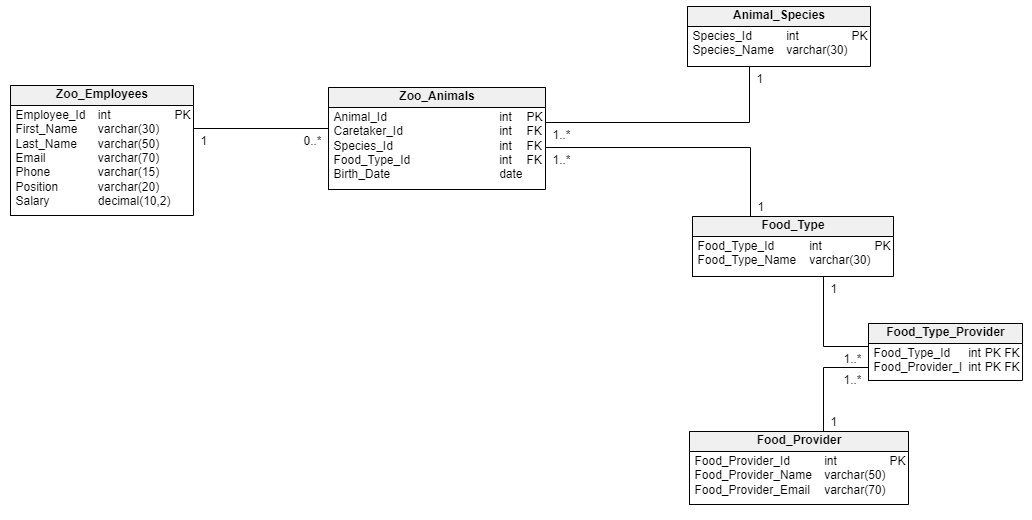
Here is an example of a physical ER diagram in UML notation:
IDEF1X Notation
The Integration DEFinition for Information Modeling (IDEF1X) notation defines entities, attributes, and relationships. Let’s discuss the details.
- There are two entity types: an independent entity and a dependent entity. An independent entity exists on its own, while a dependent entity cannot exist without the entities related to it.
- The attribute space is divided by a line into two parts: primary attributes and the remaining attributes.
- Relationships are defined by a straight line with a black circle at one end. Multipicities are defined using symbols as well as a number range.
You can read more about the details about the IDEF1X notation symbols here.
Examples in Vertabelo
Here is an example of a logical ER diagram in IDEF1X notation:
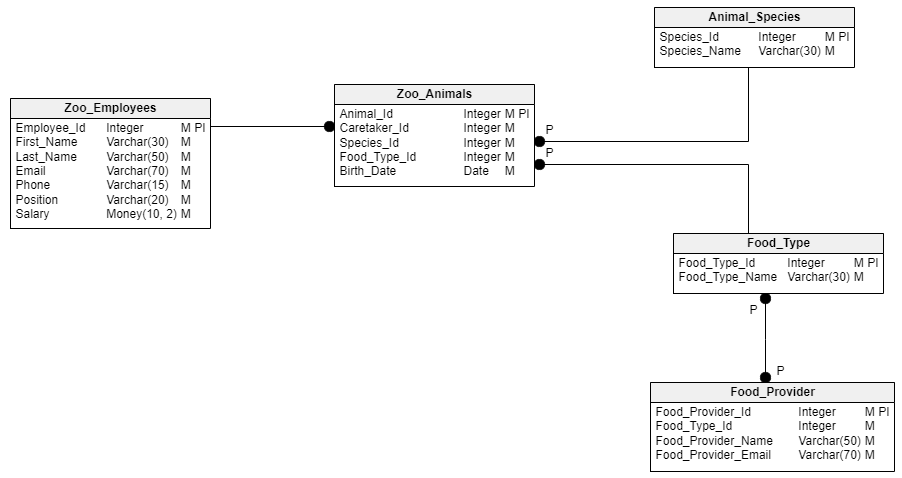
Here is an example of a physical ER diagram in IDEF1X notation:

Each notation offers a distinct yet similar way to define relationships. To learn more about it, follow our article on the theory and practice of database cardinalities.
Vertabelo lets you use different notations in creating your diagrams. For conceptual or logical models, we can use Crow’s Foot, UML, or IDEF1X. And for physical models, we can use Crow’s Foot, Barker’s, UML, or IDEF1X. Here’s how to change the diagram notation in Vertabelo.
Ready to Create an ER Diagram?
That’s all you should know before creating ER diagrams in Vertabelo.
Vertabelo lets you build conceptual, logical, and physical ER diagrams using different notations that can be changed at any time. You can choose the one that suits your requirements.
Go ahead and try it out for yourself!
