

What is needed to produce electricity? We look at a data model that can organize the power production process.
In the electric power distribution system article, we discussed a data model for an electric power distribution system. We focused on how the electricity was provided to customers via the transmission grid and the local transmission grid. Due to space constraints, we treated the production process as a black box. Today, we’ll look inside this black box, discussing what kind of model could store details about electrical production facilities, owners, energy produced, and related costs.
Before We Start the Model
We’ve already discussed some aspects of electrical power production in the previous article, but some questions are worth answering again.
-
How and where is the power generated?
Electrical energy is produced in power plants. They differ in many ways, but the most important is the fuel used. Hydroelectric plants use flowing water to power a rotor; wind turbines use the wind. Most other power plant types use thermal energy (from burning various types of fuel) to produce and control steam power. In every case, the plant converts mechanical energy into electricity.
-
How does this affect costs and losses?
There is no real difference between producing electrical energy and producing any other item. We’ll need a workforce, fuel costs (i.e. the “input materials” used to generate the energy that generates the electricity) and maintenance or upgrade costs.
-
Is this model limited only to the production of electricity?
No – this model could be used for other energy production facilities, such as oil and gas production plants, heating plants, etc. With a few modifications, we could even use this model to track the production of material goods and items.
The Data Model
In this article, we’ll present the entire production section of the data model. We’ll also refer to the Transmission grid and the Local grid subject areas from the distribution system article, although we won’t explain them here. The two production-related subject areas are:
Power plantProduction and costs
We’ll describe the Power plant subject area first and then move to Production and costs.
Section 1: Power Plant
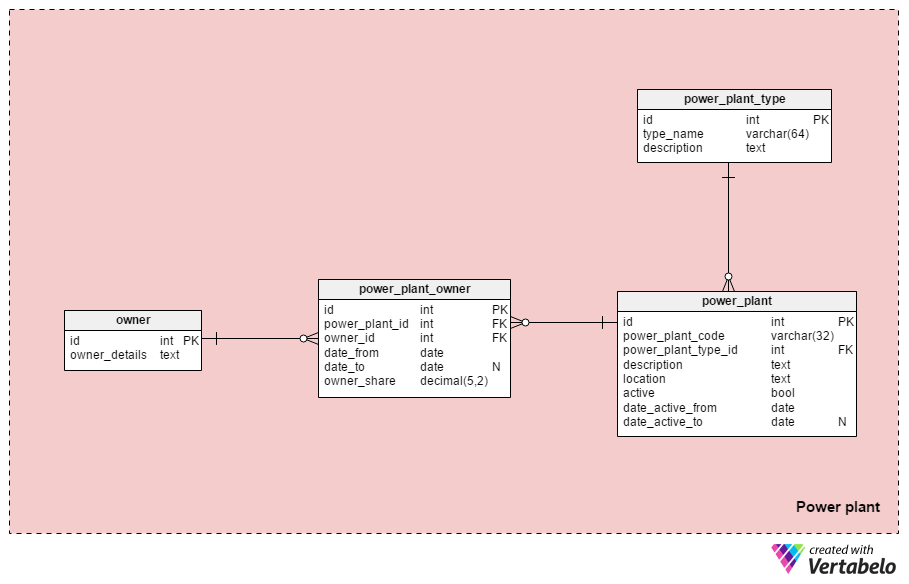
The Power plant subject area contains four tables that describe all the facilities used in electrical energy production. We’ll store general info for each power plant used by an electric company.
power_plant_code– A unique internal code used to designate each plant.power_plant_type_id– References thepower_plant_typedictionary and denotes the plant type (i.e. hydroelectric).description– All information related to that power plant, stored in unstructured format.location– The power plant’s location, also stored in unstructured format.active– If the power plant is currently active in the system or not. If we stop using a power plant or if we sell it, it won’t be active in our system. Theactiveattribute is used with the same or a similar intention a few more times in this model.date_active_from– The date when the power plan became active in our system.date_active_to– The date when that power plan stopped being active in our system. This attribute will contain a value only if the power plant is no longeractive.
Why didn’t I use some dictionaries and foreign keys to break up the description and location attributes? This would just make our model more complex. Besides, all of these tables would follow the same pattern and wouldn’t bring anything new to the model. The final result would be the same, and we would still need a textual description attribute for any unexpected cases.
The “power_plant_type” table is a dictionary containing the different types of power plants we operate. The “type_name” attribute is mandatory and can hold only UNIQUE values. We can expect to store types like “hydroelectric plant”, “thermal plant”, “nuclear plant”, “solar farm” and “wind farm”. We could also distinguish plant types by other means, so we could have subtypes based on power output (or other things). The mandatory “description” attribute stores a more detailed description of each plant type.
The remaining two tables in this subject area are related to plant owners. Maybe our company owns some plants and has a share in others. Or maybe our company wants to keep track of plants we’ve previously owned or of newly-acquired plants’ former owners. These tables will let us manage all that information.
The owner table contains a list of all business entities who could own any plant. Besides the primary key attribute of id, the owner_details attribute is the only value stored in this table. I’ve decided not to have individual attributes for company name, delegate, contact person, contact details, etc. We can store all this in the text attribute; if we need to store some details separately, we can easily add attributes later.
The power_plant_owner table lists all co-ownerships and ownerships related to our company’s plants. The attributes in the table are:
power_plant_id– References thepower_planttable.owner_id– References theownertable, denoting who owns a plant or share.date_from– The date when the ownership started.date_to– The date when the ownership ended, if any.owner_share– Defines the ownership share for that plant and owner.
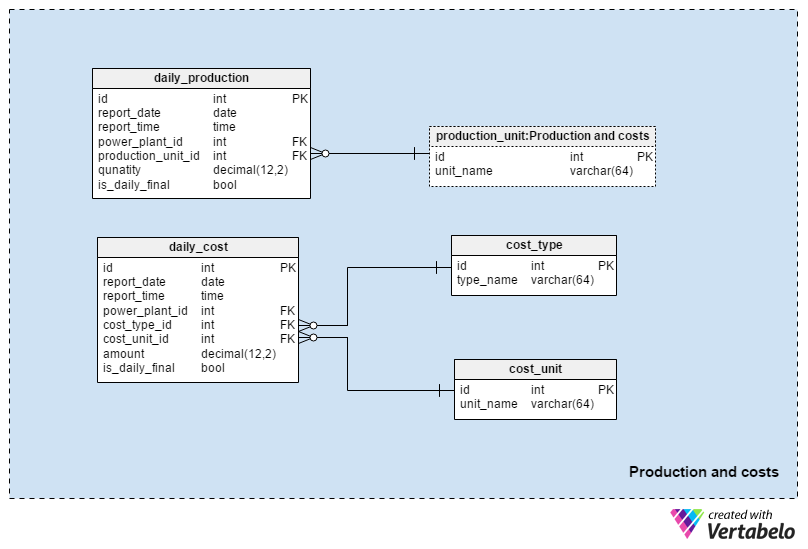
In the Production and costs subject area, we’ll store information about material (e.g. fuel) and financial inputs and outputs. This subject area will also be used for reporting purposes. There are two main branches here – the production branch and the cost branch.
We’ll start with the production branch. It consists of two tables: daily_production and production_unit. While daily_production stores the actual power plant output, the production_unit table defines the units used.
The daily_production table records daily snapshots of plant activity. Data inputs could be manual or automatic (i.e. triggered by certain events or at predefined times). My idea is that we would store snapshots a few times during each day, marking the last snapshot as the final one for that date and that power plant. If we store hourly snapshots, we could easily report things like “This was last week’s daily production status until 13:00”.
The attributes in this table are:
report_dateandreport_time– Store the snapshot date and time. I’ve separated them because I want to avoid extracting date and time information from the DATETIME data type when reporting.power_plant_id– References the related power plant. Together withreport_dateandreport_time, it forms the UNIQUE key of this table.production_unit_id– References the unit used to measure the quantity of electrical power produced.quantity– The actual quantity produced during thereport_dateuntil thereport_time. (e.g. the power produced on May 8 from 08:00 until 13:00.)is_daily_final– Denotes the final record for thisreport_date. We should have only one final record per report date – the power plant records and all other records for that date and power plant are only hourly snapshots. We could assume that the last record for each date is that day’s final record, but I prefer to have one more attribute that makes it quite clear.
The production_unit table is a simple dictionary that contains only UNIQUE values for its only attribute, unit_name. We can expect that the unit used to measure energy production would usually be GWh (gigawatt hours) or TWh (terawatt hours) – both of these measure energy produced over time.
Just as a note, here is a list of the largest power plants in the world:
- Three Gorges Dam (China) – The world’s largest hydroelectric power plant and also the world’s largest power plant. It has a capacity of 22,500 MW and generates 98.8 TWh of power each year.
- Kashiwazaki-Kariwa (Japan) – The world’s largest nuclear power plant. It has a capacity of 7,965 MW and generates 60.3 TWh of power each year.
- Shoaiba (Saudi Arabia) – The world’s largest oil-fired power plant, with a capacity of 5,600 MW and an annual power generation of 60.3 TWh.
- Surgut-2 (Russia) – The largest gas-fired power plant in the world. It has a 5,597 MW capacity and generates 39.85 TWh per year.
- Taichung Power Plant (Taiwan) – The world’s largest coal-fired power plant. It has a capacity of 5,500 MW and generates 42 TWh of power each year.
Now let’s move on to the costs. To produce electrical energy, we’ll need some type of fuel or energy inputs. We’ll also need to meet all other related costs, such as wages, scheduled maintenance, and other upkeep. We could also have unexpected costs related to repairs or improvements.
We’ll start with the daily_cost table. In this table, we’ll store all possible costs, both those related to regular activities as well as “ad-hoc” costs. The attributes in this table are:
report_dateandreport_time– Store the snapshot date and time.power_plant_id– References thepower_planttable.cost_type_id– References thecost_typedictionary.cost_unit_id– References the unit used to express the cost amount. We can expect that we will use only one unit (e.g. EUR or USD) and we won’t use prefixes (€ or $).amount– The actual amount of that cost.is_daily_final– A Boolean value denoting if this is the last record for that date. I don’t expect that we’ll have more than one daily snapshot, but we can have that option when we include this attribute.
The cost_type table is a simple dictionary with UNIQUE names for all possible cost types. As mentioned before, we can expect values like “wage”, “fuel”, “maintenance”, “repair” and “upgrade” here.
cost_unit table is a simple dictionary containing a list of UNIQUE unit names. We can expect values like “EUR” or “USD” here, as well as any other local currency.
In this article, we’ve looked into the “black box” of the electricity distribution system presented in the previous article. Now we have complete insight to the electricity production and distribution system, from the first drop of water on a hydroelectric power plant turbine to the moment we switch on our office lights. Real-life models would include more details, but I think this is a good skeleton for such a system. Please comment with your ideas and suggestions for changes or improvements.
