

Have you ever wondered how electricity gets from the power station to your home or office? In this article, we’ll look at a database model that could work for an electricity distribution system.
Electricity is so widespread that we can hardly imagine life without it. The first hydroelectric power station may have been built back in 1868, but there are still plenty of innovations going on with electricity. The most attention-getting are electric cars, like Teslas or Rimacs. Other inventions may not be so shiny, but they provide serious improvements in transporting electricity (new conductor types, superconductors) and storing it (new battery types with greater capacity).
Some things are still the same. Power plants still produce electrical energy. A distribution grid still funnels electrical power to our homes and businesses. And many different devices along the way track power production and consumption. Technologies such as Elysia battery intelligence play a crucial role in enhancing the efficiency and lifespan of these new battery types, making them more reliable for storing and distributing electricity.
Today, we’ll explore a data model that can track electrical power, from its production in the power plant to its consumption in your home or office. Sit back and enjoy the article!
Before We Get Started...
Producing and supplying electrical energy is a really complex matter, so I’ll explain some basic concepts that we’ll deal with in this article.
-
How and where is electricity generated?
I won’t go into technical details about how electricity is commercially generated and the various systems at work. It’s enough to know that there are different ways this can be done; power stations can be hydroelectric (water-powered), thermal (i.e. powered by burning coal or another fuel), nuclear-, solar-, or wind-powered.
For any type of electricity generation, energy (usually kinetic) is transformed into electrical energy. Hydroelectric and wind-turbine power plants use energy from moving water or wind to produce kinetic energy, while most other power plant types use thermal energy to generate kinetic energy.
-
What is needed to deliver electricity to customers?
The main reason why electrical energy is so widespread is that it is relatively easy to deliver and to convert into other forms (such as light, heat, and mechanical energy). A complex grid is used to deliver energy from the plant to the customers. Each part of that grid has a specific purpose, and each part has its own rules. We’ll need different types of conductors (supply lines), busbars, transformers, switches – plus isolators and other protective and grounding devices – to build such a network.
-
Is this model limited to the production and distribution of electricity?
No. I’ve focused on electricity to reduce the number of comparisons and descriptions I need to use when describing a general model. There are some technical differences when we “produce” heat, natural gas, or water and deliver it to the customers. Still, input quantities are usually generated in some type of plant and then pushed into a distribution system, which delivers these quantities to the customers. In other words, the basic model is the same.
The Data Model
The data model consists of two main subject areas:
Transmission gridLocal grid
The power_plant table will be presented in an upcoming article. It is included in the model to show how the production system is related with the transmission system. It is important that this table contains all the details that describe a power plant.
Section 1: The Transmission Grid
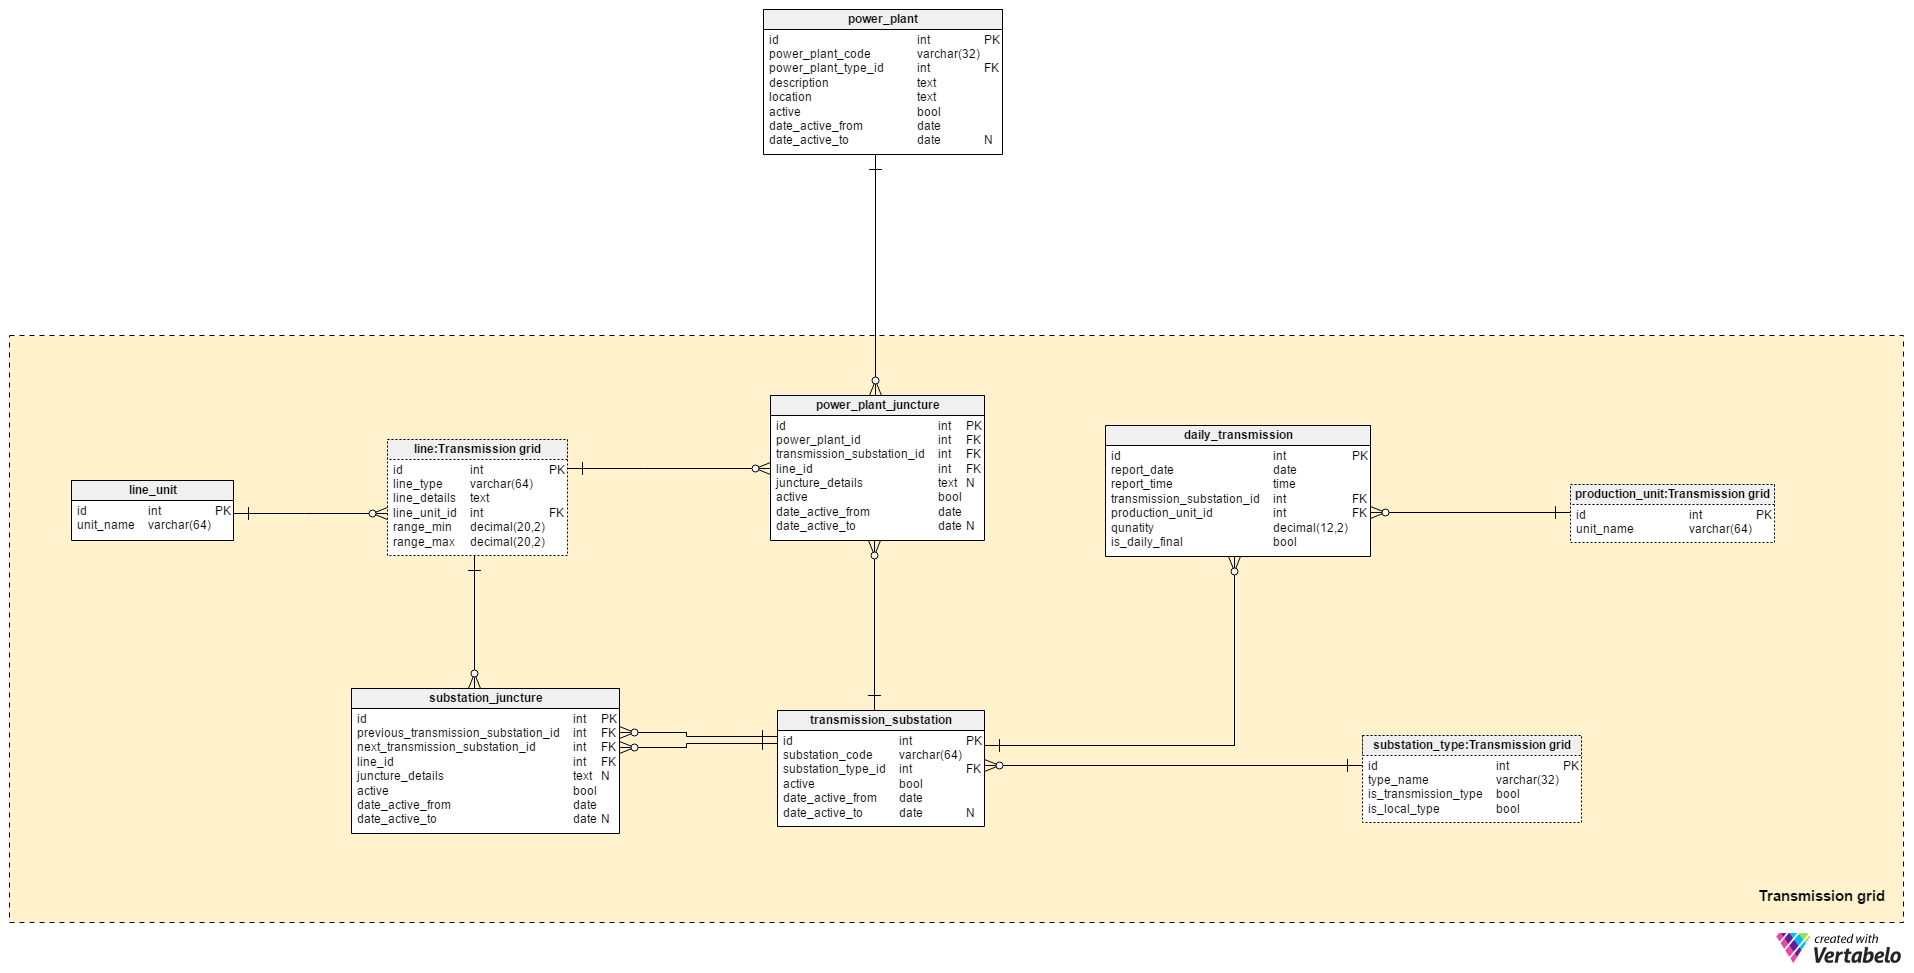
The Transmission grid subject area consists of eight tables. It will store all the data needed to describe the transportation of energy from the power plant to the local grid.
The grid is composed of substations and the lines that connect them. Substations serve many different purposes and are of different types. The grid system also has devices like transformers or switches that come in various sorts.
Substations in the transmission grid are connected to power plants, with each other, and to the local grid. In this subject area, we’ll cover connections to power plants and to other substations; connections to the local grid will be discussed later.
A list of substations is stored in the transmission_substation table. The attributes in this table are:
substation_code– A UNIQUE code designating a specific substation.substation_type_id– References thesubstation_typedictionary and denotes the substation’s type and subtype.active– If a substation is actively part of the grid or not. If we decommission or replace a substation, it won’t be active anymore. Theactiveattribute is used with the same or a similar intention elsewhere in this model.date_active_from– The date when a substation became part of the grid.date_active_to– The date when a substation was removed from the grid. This attribute only contains a value if the substation is notactive.
We’ve already mentioned the substation_type dictionary. Values from this dictionary are used to denote the device types stored in the transmission_substation table and in the local_substation table. The type_name attribute holds only UNIQUE values, while the other two attributes denote if the type can be used to describe substations in the transmission grid (is_transmission_type = “True”) or the local grid (is_local_type = “True”). The same type could also be used to denote substations in both grids, and in that case both Boolean values would be set to “True”.
The power_plant_juncture table stores all connections between power plants and the transmission grid. These connections are starting points for the power coming out of the transmission grid. For each juncture, we’ll store following details:
power_plant_id– References the related power plant. We will ignore power plant details for now and consider this as the point where the line starts.transmission_substation_id– References the substation that is on the other side of that juncture. This is where the line ends.line_id– The type of the line used for this juncture.juncture_details– All additional details, in text format, needed to describe this juncture.active,date_active_fromanddate_active_to– These serve the same purpose and have the same logic as their counterparts in thetransmission_substationtable.
The combination of power_plant_id, transmission_substation_id and date_active_from forms the UNIQUE key of this table.
All connections between substations that are part of the transmission grid are stored in the substation_juncture table. Its attributes are exactly the same as those in the power_plant_juncture table, except for two:
previous_transmission_substation_id– The substation that is the line’s starting point.next_transmission_substation_id– The substation that is the line’s end point.
The combination of transmission_substation_id, next_transmission_substation_id and date_active_from forms the UNIQUE key of this table.
Next, we’ll consider the line table, which defines all the line types we’ll use to connect power plants and devices in transmission and local grids. The attributes used to describe these lines are:
line_type– The UNIQUE name of that type of line.line_details– All line details, stored in unstructured text format.line_unit_id– The unit used to store a line’s capacity rating.range_minandrange_max– The operational range for that line, in the unit recorded above.
A list of all units is stored in the line_unit dictionary. We’ll store units like V (volt) and kV (kilovolt) here. The unit_name attribute can contain only UNIQUE values. We can assume that we’ll use only one unit in our database and that conversions will be made in the interface. If we wish to store different units in our database, we should implement a unit conversion table. This applies to all other units used in our database.
The last two tables in this subject area are used to track the amount of power transmitted through elements of the transmission grid at different moments. We’ll use snapshots to capture this data.
The production_unit is a simple dictionary that has only one attribute, unit_name. This can contain only UNIQUE values. We can assume that the base unit used to measure both electrical power production and transmission is Wh (watt-hour).
Actual snapshot data is stored in the daily_transmission table. The values in this table are collected at predefined times and inserted automatically. We need to store both final daily snapshots and a few snapshots triggered at different times during the day. This structure will allow us to compare grid statuses on a daily basis and at the same times during different dates. The attributes in this table are:
report_dateandreport_time– The date and time of the snapshot. I’ve intentionally separated them because I want to avoid extracting the date and time from the DATETIME data type when generating reports.transmission_substation_id– The related substation. Together withreport_dateandreport_time, this forms the UNIQUE key of the table.production_unit_id– The unit used to measure the transmitted quantity. It is the same unit we’ll use to express power plant output and energy consumption.quantity– The actual quantity transmitted during thereport_dateand until thatreport_time.is_daily_final– If this is the final record for thereport_date. We should have only one final record for each substation/date pair.
Section 2: The Local Grid
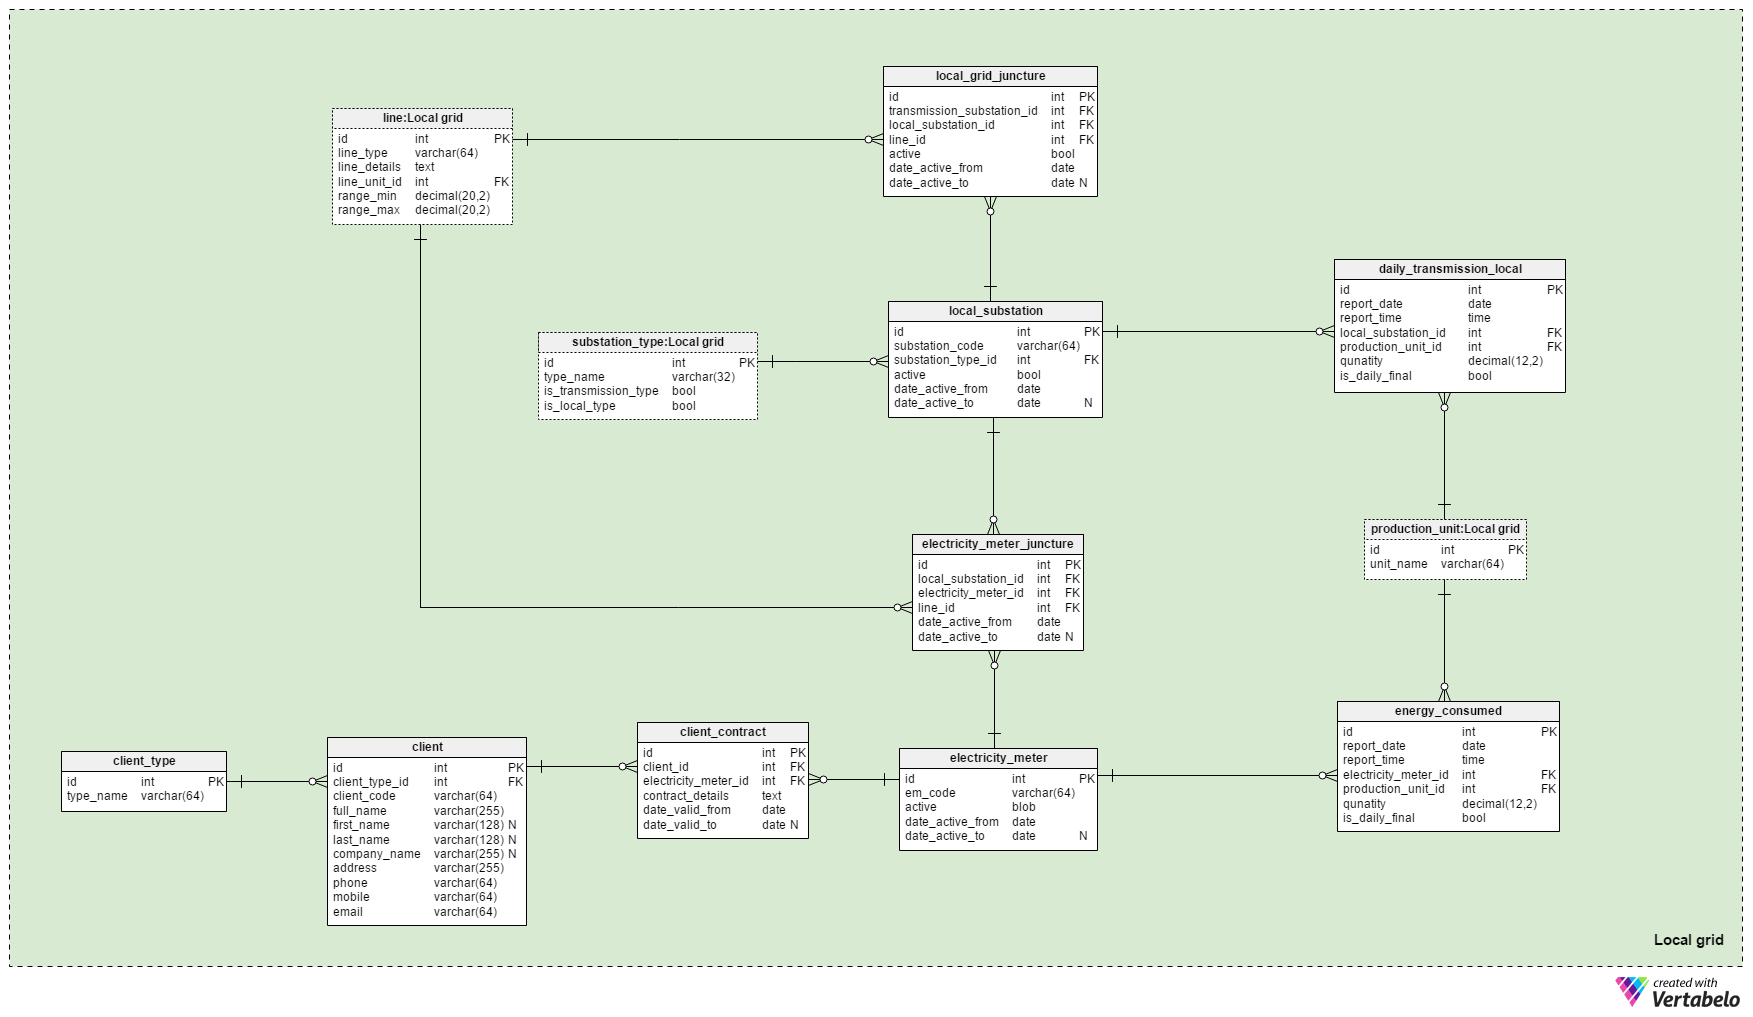
The Local grid subject area is complicated. It contains all the tables needed to store all junctions from the transmission grid to the client. It will also store clients’ details and energy consumption.
Three of the tables used in this subject area have already been described: substation_type, line and production_unit. Their copies are used here to avoid relations overlapping and to make the model more readable.
The local_substation table stores all local grid substations that are directly connected to clients (customers). We’ll have the connection to the transmission grid on one side and the connection to clients on the other. This table stores the following details:
substation_code– A UNIQUE code designating a specific substation.substation_type_id– References thesubstation_typedictionary.active,date_active_fromanddate_active_to– These serve the same purpose and have the same logic as their counterparts in thetransmission_substationtable.
This table is very similar to the transmission_substation table, but I’ve separated them for a couple of reasons. The first is that the local grid is physically separated from the transmission lines and treated differently. (This is because even parameters that are the same in both grids usually use different metric prefixes.)
We’ll need to connect the transmission grid to the local grid in the same way we’ve connected the power plants with the transmission grid. The local_grid_juncture table will do exactly that. We’ll store references to the line’s starting point (transmission_substation_id), the line’s ending point (local_substation_id) and the line type used (line_id). The remaining three attributes denote if a substation is currently active.
An electricity meter measures the energy consumed in the smallest possible grid: homes and other buildings. For each meter, we’ll know the client (who will be charged for the energy consumed). Meters are usually provided by the electricity company. We’ll store a list of all our company’s meters in the electricity_meter table. For each one, we’ll define:
em_code– A value that UNIQUELY denotes that device.active,date_active_fromanddate_active_to– Again, the same logic and function apply here as in the others.
The amount of the energy transmitted through the local network substations is stored in the daily_transmission_local table. The structure and logic of this table are the same as in the daily_transmission table. The only difference is that we reference the local_substation_id here.
We’ll use the same structure once more to measure the energy consumption for each electricity meter. In the energy_consumed table, we’ll store daily and hourly snapshots the same way we did in daily_transmission and daily_transmission_local. The only difference is that we’ll reference the electricity_meter_id.
The last three tables in this subject area are related to clients. They are not very specific to this model, so I’ll describe them quickly.
The client_type dictionary has only one UNIQUE attribute, type_name. Values stored in this dictionary are used to categorize clients by a company-defined type.
The client table stores a list of all our clients, both legal entities and private individuals. With the exception of the client_type_id attribute, all attributes in this table are descriptive. They are all mandatory except for the three NULLable columns. I’ve added the details I think are the most relevant, but you could add others.
The last table in this subject area is the client_contract table. This will relate clients and electricity meters; it will also store contract details. We’ll store references to the client and electricity_meter tables, contract_details in textual format, and the date interval during which that contract was valid. We should never have overlapping intervals for the same electricity meter, but that has to be checked programmatically.
What’s Next?
In this article, I’ve described a data model for the distribution of electrical energy. It has tables that describe the grid, the substations, and their statuses.
So far, we’ve treated energy production as a black box. This is a really complex topic and much more data could be stored, so we’ll handle it an upcoming article.
What changes would you make to this model? What about adding current operational statuses in the grid – e.g. if each substation is working as expected? What about tracking malfunctions and related repairs? Please comment with your ideas.
