

Can you design an OLAP database model from an OLTP model? In this article, we’ll show you how!
This is the second article of our data warehouse (DWH) series. You can find the first one here. The idea behind the series is to start with the OLTP (Online Transaction Processing) database model, present a possible solution for the reporting/OLAP (Online Analytical Processing) data model, and then finally consider the code we’ll use to perform the ETL process.
We’ve already talked about the OLTP database model in the first article. If you haven’t already read that article, I encourage you to do so now. It will help you understand the business model we’re dealing with.
In today’s article, we’ll tackle the second part: the OLAP data model. The third and final article will discuss the ETL process.
Are you ready to see what we’ve got for the OLAP model?
The Data Model
As is usually the case with any database model, the tables and attributes we’ll include will depend on what we need the data for. This concept is pretty obvious for OLTP databases — you need a place to store the required values — but for the DWH, it’s not so immediately obvious.
We’ll only create fact tables for the data we need to include in our reports. The dimension tables and the report granulation will also depend on the categories in our reports and the reporting frequency. If we have reports with daily granulation, we’ll need time dimensions at the daily level and regular daily inserts in the DWH.
We can assume that we’ll have reports at higher levels (such as monthly, quarterly, and yearly) and for specific things. In fact, any business can expect to deal with the same questions very frequently. For example, knowing the number of active customers and subscriptions at any time or during any period is highly import for our subscription business. Knowing what has been or will be delivered to customers, and when these deliveries take place, is also very important.
Obviously, all these reports will need to have the time dimension; the delivery reports will also need the location dimension.
In short, we should be able to get the data out of our DWH, granulated on the level we choose, at any time. We could report it as-is or — more likely — compare it to other periods and use this to make assumptions and projections for the future.
I went with two assumptions:
- We’ll update our database daily, and
- We’ll have daily granulation of the time dimension.
The second assumption is related to the data and categories we need to include in our reports. Therefore, we’ll have three subject areas:
- Customers & subscriptions – Includes two fact tables, one for customer data and another for subscription data, and two (needed) dimension tables.
- Deliveries – Includes one fact table for delivery data and three dimension tables.
- Products – Includes one fact table for product data and three dimension tables.
We’ll take a look at each subject area separately and closely describe the fact and dimension tables included.
Section 1: Customers and Subscriptions
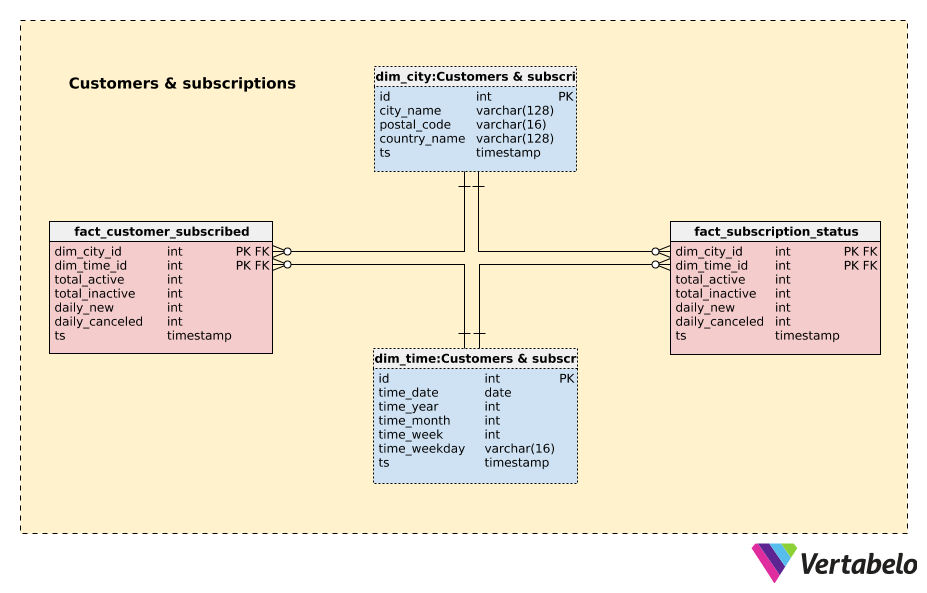
The Customers & subscriptions subject area is the only subject area in this DWH model contain two fact tables, fact_customer_subscribed and fact_subscription_status. Both of these tables have the same structure, but they will store different data. Previously, we’ve already discussed how one customer could have multiple subscriptions, either active at the same time or not.
There are also two dimension tables in this subject area. These will also be used in other subject areas. (Dimensions referenced by multiple fact tables are called “conformed dimensions”.)
I’ll start with the two dimension tables first. The most obvious dimension — you can expect it in nearly every data warehouse — is the time dimension table, dim_time. This table contains the following attributes:
time_date– A UNIQUE value denoting the reporting date. We can expect that we’ll add one line in this table for the previous date, so we’ll have one record for each date since the DWH was initially populated.time_year,time_month,time_week, andtime_weekday– Are all parts of thetime_dateattribute or are generated from it. The idea is to store these values separately in order to avoid additional operations when we query the DWH. For example, we could easily compare the number of new subscriptions for each Monday in the current year simply by using the attributestime_weekdayandtime_year.ts– A timestamp when this record was inserted in the table. I’ll use this attribute in all tables and in the same way, so I’ll explain it only once. We can expect that we’ll run the ETL (extract, transform, and load) process at the same time each day and that we’ll provide atsvalue when we call procedures or code. Thattsshall be used when we insert data into our tables. This way, we could check if the ETL process was already performed that day. If it had been, we could delete the previously inserted data for the same date and insert everything from the start of the day. (Note: This type of column has no business meaning and is commonly referred to as a "technical column" in database modeling.)
The second dimension table is the dim_city table. In this table, we’ll store information about the cities and countries we have in our OLTP database. For each record, we’ll store a UNIQUE combination of city_name – postal_code – country_name.
The remaining two tables in this subject area, fact_customer_subscribed and fact_subscription_status are fact tables. They will contain the data we need in our reports. Both tables share almost the same structure and column usage, so I’ll explain them together. The attributes in these tables are:
dim_city_idanddim_time_id– Are references to the two previously-mentioned dimension tables. This means that we’ll store aggregate data (numbers) separately for each date and each city. The combination of these two attributes is the UNIQUE key in both tables and also a primary key. We don’t have a single-column primary key attribute (e.g. an id column) because we wouldn’t benefit from it; searches will be based on foreign key values that reference dimension tables.total_active– The total number of active customers/subscriptions on that day. This includes all customers/subscriptions, not just the ones that signed up on that day.total_inactive– The total number of inactive customers/subscriptions on that day. This includes all customers/subscriptions, not just those that unsubscribed on that day.daily_new– The number of new customers/subscriptions that subscribed on that day.daily_canceled- The number of customers/subscriptions that unsubscribed on that day.
Now that we’ve seen this subject area and its tables, we can easily see the reports we can produce using simple queries. We can ask for any date range, compare a selected day with the same weekday a week ago, or compare monthly and yearly data. And we can combine all of that with the city dimension.
This even allows us to delete (or migrate) unneeded data from the OLTP database and to keep our reporting accurate. The only problem we can expect is when we would like to add new data or numbers to the fact tables. In that case, we would need to recalculate the old values and change our ETL process accordingly.
Section 2: Deliveries
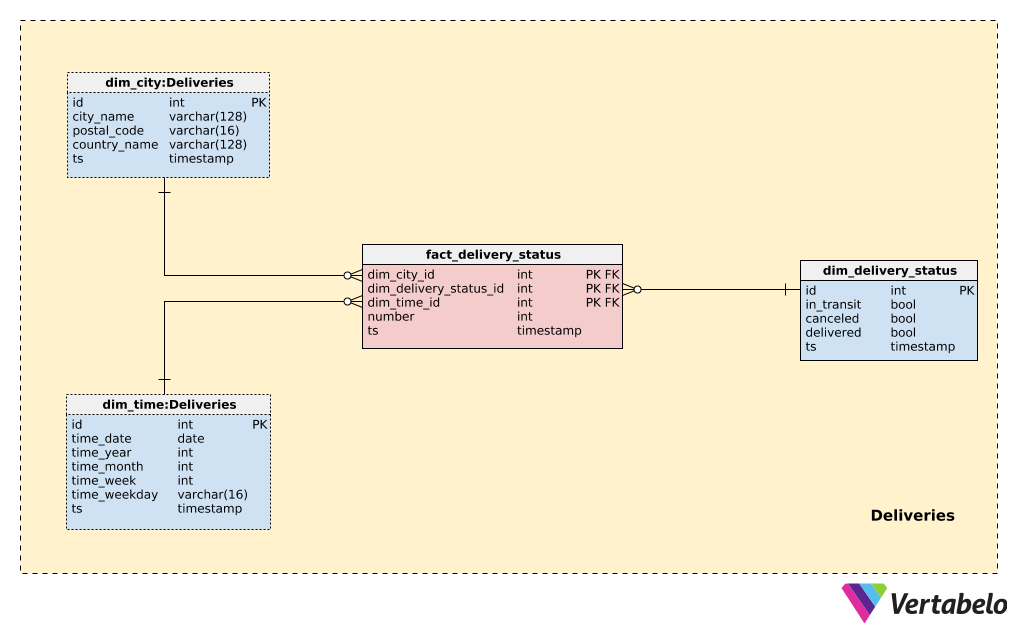
In the first subject area, we set everything up to track the number of customers and subscribers, but these numbers don’t tell anything about the performance of our business. The second and the third subject areas in our model are focused on deliveries and products delivered.
We’ll have one new dimension table in this subject area, the dim_delivery_status table. This table will be populated from the delivery_status_catalog table, which we presented in the OLTP data model. I went with the assumption that we’re not interested in any specific status in reports; rather, we’ll be looking at whether the delivery is currently in_transit, canceled, or delivered. That’s why this table has only these three Boolean values.
We’ll store the data needed for reporting in the fact_delivery_status table. The combination of foreign keys referencing dimension tables (dim_city_id, dim_delivery_status_id, dim_time_id) will again be the UNIQUE value and the primary key for this table. The only data we’ll store here is the actual number of cases for each category. This will allow us to quickly query what is happening with our deliveries in specific data ranges and cities.
Section 3: Products
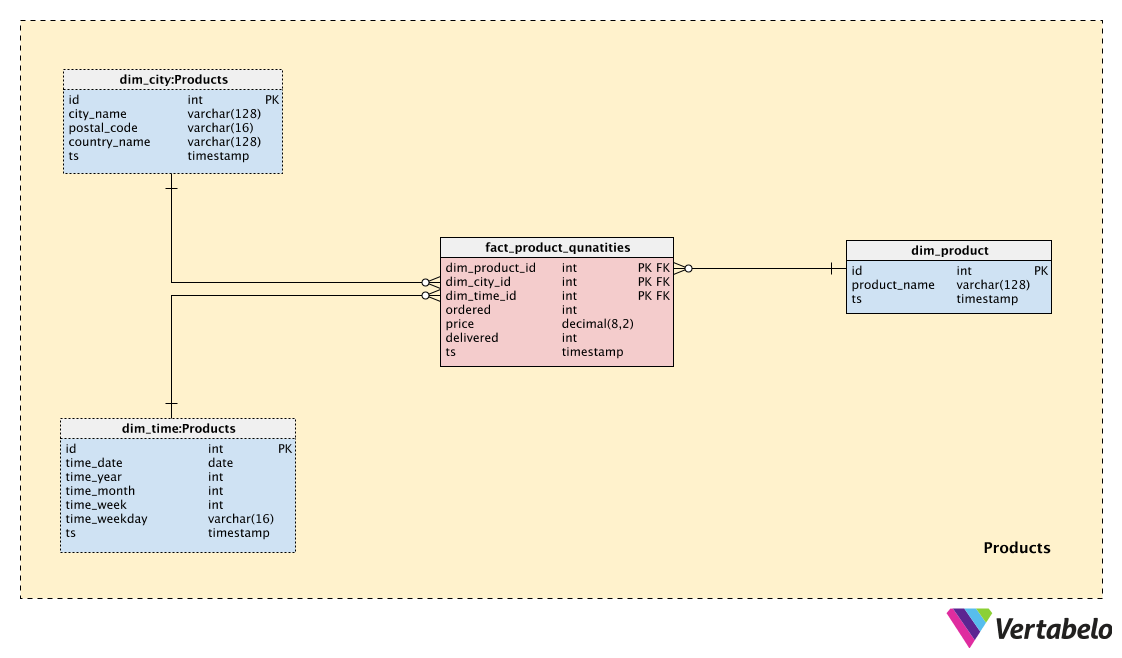
The last subject area in our model is Products. This is the place where we’ll store reporting data related to the products included in our deliveries.
Again, we’ll have one new dimension table here, dim_product. It contains a list of UNIQUE product_name values copied from the OLTP database.
The last table in our model is the fact_product_quantities table. The UNIQUE combination of the foreign keys dim_product_id, dim_city_id, and dim_time_id is once more the primary key in this table. For each combination of the above, we’ll store a number of ordered and delivered products as well the price. While price itself is not the aggregate data and will be repeated a few times in this table (for the same date), by storing it here we avoid the necessity of a more complex structure in the product dimension table.
This will allow us to track our products, orders, and deliveries on the daily level and also provides for granulation on the city level.
What Do You Think?
We could definitely have included more data in both the OLTP and OLAP databases. For instance, I haven’t included anything for monitoring warehouse status, which is crucial in a subscription business. The reason is that I wanted to focus more on creating an OLAP database from an OLTP database and showing how to populate it. This means I have to avoid additional details that would lead to me describing almost the same concepts again.
Have you worked in an industry similar to a subscription business, or on a similar DWH? What did we miss in this model? Would you add or remove something? Please tell us in the comments below.
